Navigation
Use the Threat Prevention Administration Console to:
- Create and configure policies and policy templates
- Configure analytics
- Deploy and manage Agents
- Import and export Threat Prevention policies and policy templates
- Configure alerts
Policies control the real-time event monitoring/blocking of files and directories, users, groups, Active Directory objects, and Microsoft Exchange objects. These policies enable Threat Prevention to detect and report changes as well as send notification when changes occur.
Administration Console Components
The Administration Console has the following components:
- Menu
- Policy Center
- Status Bar
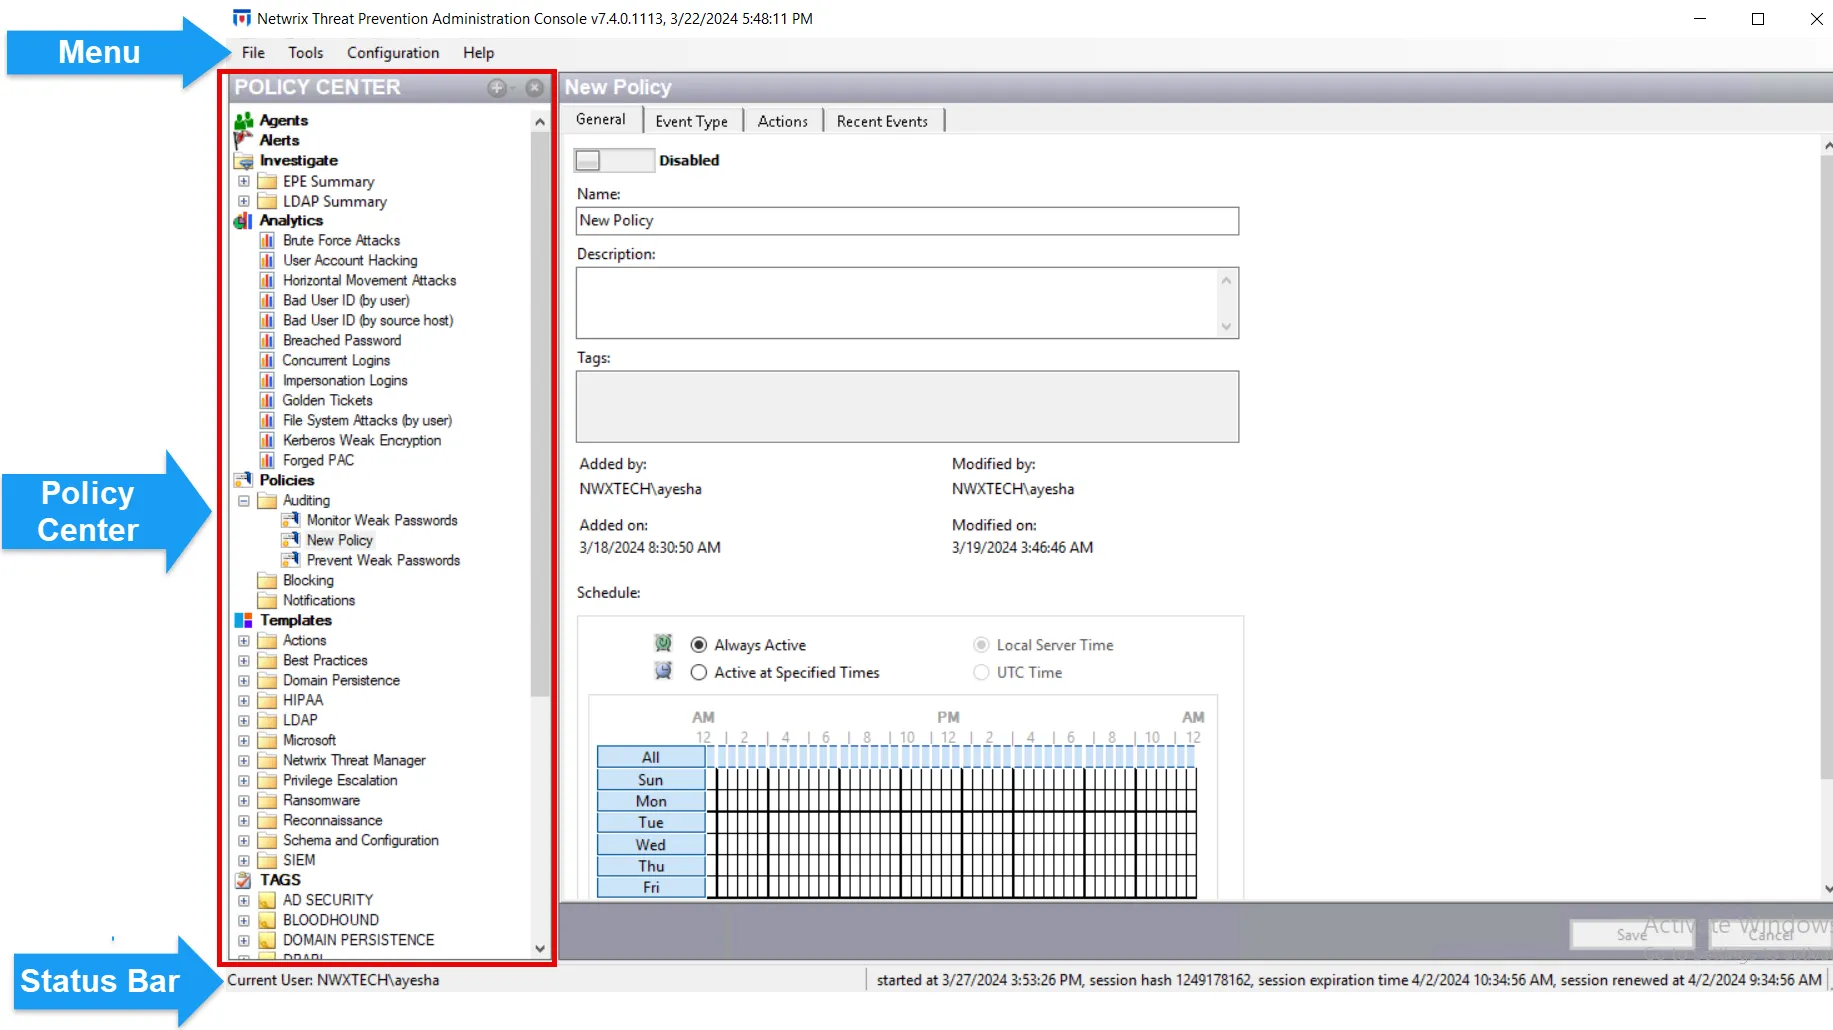
Different sections of the Policy Center also provide right-click commands.
If the Administration Console user interface or windows don't display properly, see the Troubleshooting FAQs topic for information.
Menu
The Menu contains the following selections:

| Menu Item | Option | Description |
|---|---|---|
| File | New | Create new policies (Ctrl+P), new templates (Ctrl+T), or new folders (Ctrl+F) in the selected location of the Policy Center |
| Rename | Opens a textbox to rename the selected policy, template, or folder in the Policy Center | |
| Remove | Removes the selected policy, template, or folder from the Policy Center | |
| Exit | Exit the Administration Console | |
| Tools | Export … | Export (Alt+X) policies and templates through the Export Policies and Templates Window |
| Import … | Import (Alt+I) policies/templates, collections, and event consumers/alerts from an exported file through the Import Window | |
| Configuration | Alerts | Configure and manage all email, event log, and SIEM alerts in the System Alerting Window |
| Users | A security feature for configuring access to the Administration Console. Add users and assign them rights through the Users and Roles Window. | |
| Database > Server | Manage the events database in the Events Database Configuration Window. You can view the information, but can't make changes. | |
| Database > Maintenance | Use database maintenance to automatically groom the database to optimize performance by archiving and/or deleting data aged beyond a specified threshold. You can configure this to run by Event Type, Analytic, or Policy. Configure it in the Database Maintenance Window. | |
| Collections | Manage all Microsoft Collections in the Collection Manager Window | |
| Event Filtering | Filters Active Directory events to remove “noise” from collected event data and/or exclude logins from machine accounts. Both settings are ON by default. It also lets you exclude authentication events from selected hosts or accounts, which require configuration before you enable them. You can set a latency threshold to generate alerts when the delivery of AD Events is delayed beyond the threshold. Configure these options in the Event Filtering Configuration Window. | |
| Netwrix Threat Manager Configuration | Enables integration between Threat Prevention and Threat Manager in a global setting. Set the Threat Manager URI in the Netwrix Threat Manager Configuration Window. Choose policies through the Policy checkboxes in this window or the Actions tab of each policy for sending event data to Threat Manager. | |
| File Monitor Settings | Manages the log retention, inherited permissions filtering, disables office file filtering, and the ability to exclude AD accounts and processes for Threat Prevention file monitoring and blocking policies in a global setting. Set these options in the File Monitor Settings Window. | |
| EPE Settings | Manages the Have I Been Pwned password hash database configuration and update options as well as global Password Rules filter configurations. Configure these options in the EPE Settings Window. | |
| Help | Administration Console Help | Opens the internal help documentation |
| License Manager | Opens the Threat Prevention License Manager Window, which displays the customer name, license expiry date, and licensed modules | |
| About Netwrix Threat Prevention Administration Console | Opens the Administration Console window, which displays the product version, copyright, and the Netwrix website link |
Policy Center
The Policy Center is the primary interface of the Administration Console. It is divided into two sections: the Navigation pane and the Display area.
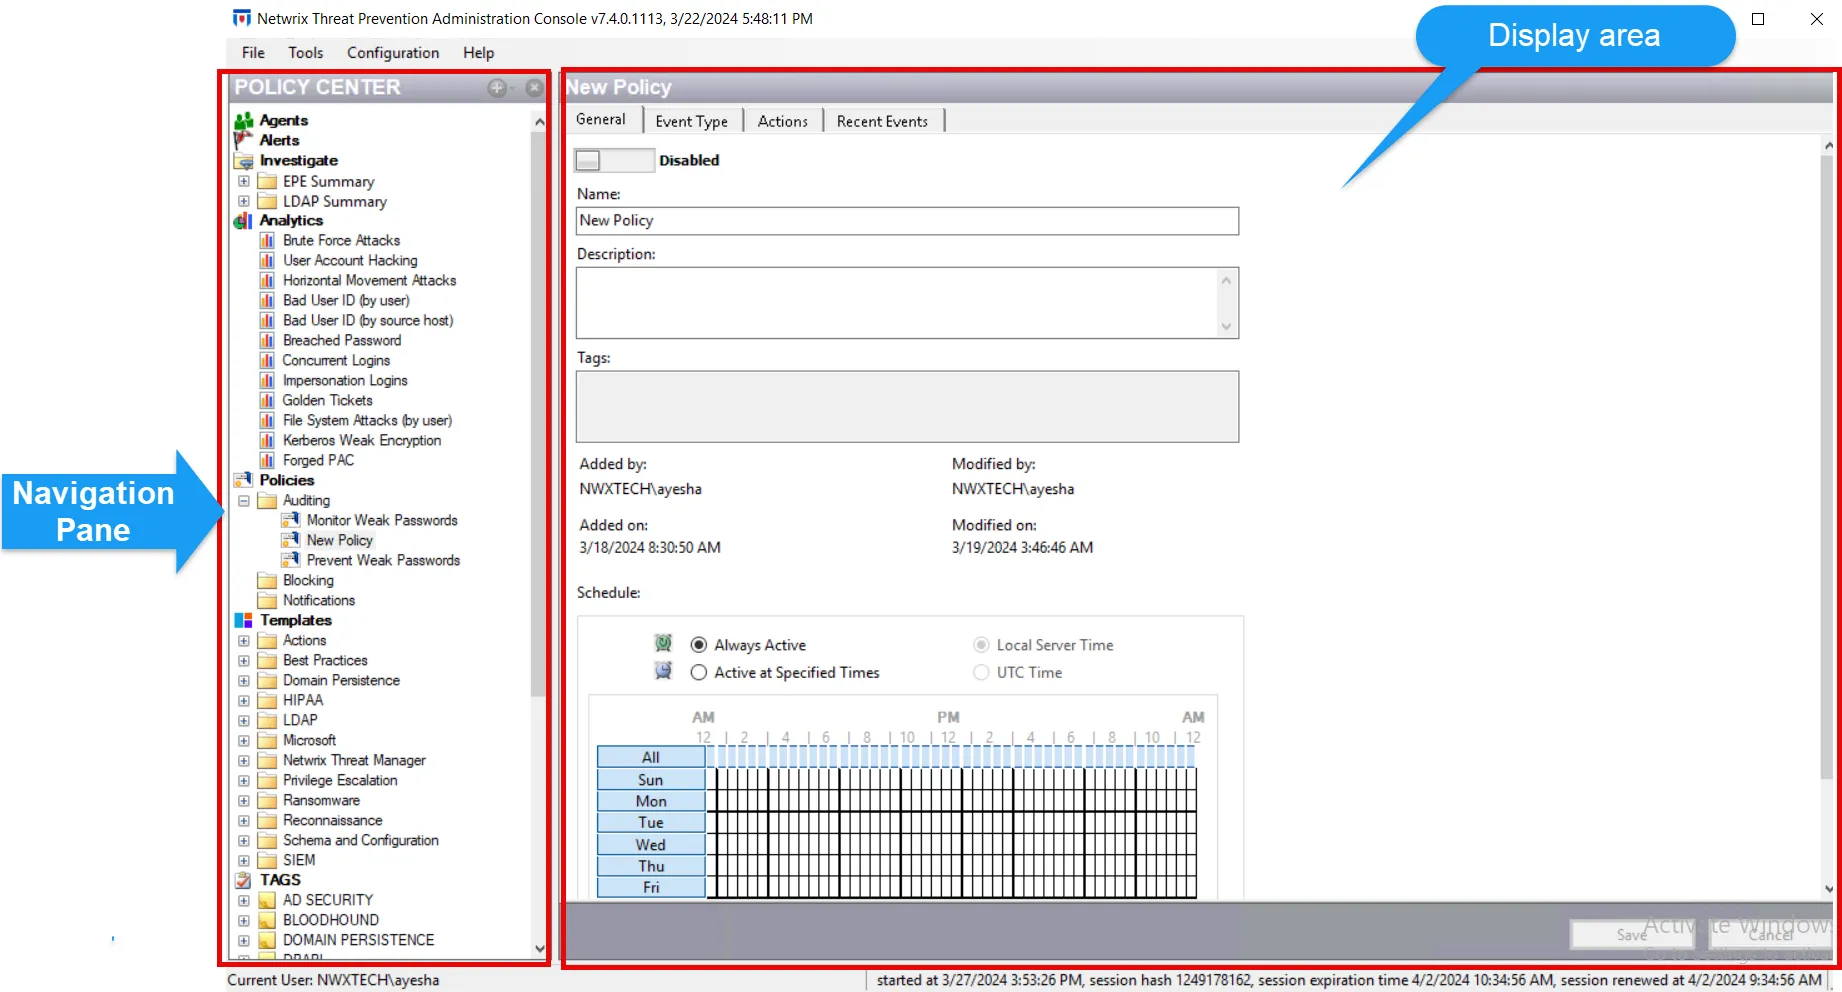
The Navigation pane provides interface options while the Display area displays the selected interface. The following interface options are available:
- Agents Interface
- Alerts Interface
- Investigate Interface
- Analytics Interface
- Policies Interface
- Templates Interface
- Tags Node
Several right-click menus and additional features are available within these interfaces.
Remember, the Investigate, Analytics, Policies, Templates, and TAGS nodes in the Navigation pane can be expanded and collapsed.
Agents
The Agents interface provides data about the Agents within the environment. This includes what domain the Agent is in, what machine it is deployed on, its current status, and other details. This interface also indicates if a domain controller doesn't have an Agent deployed on it. Through this interface, you can deploy, update, and manage Agents; configure logging levels; access logs; and export Agent information.
Alerts
The Alerts interface provides information on the Threat Prevention Security events, Operations events, and Configuration events. By default, the interface displays all events. However, you can filter, sort, and search them.
Investigate
The Investigate interface is a reporting tool for the Administration Console. It provides information on recent events monitored or blocked by any enabled policy. By default, all events recently monitored or blocked are available. However, you can filter them to particular policies, perpetrators, time frames, domains, servers, computers, events, etc.
Analytics
The Analytics interface is a front-line warning tool for detecting incidents in real-time based on patterns within collected event data indicative of potential security risk. It provides information on incidents identified by the analytic policies.
Policies
The Policies interface provides a central location for creating and configuring all policies. When you select the Policy node, the Display area lists the policies. In the Navigation pane, Threat Prevention organizes the policies into folders. By default, the folder structure includes, but isn't limited to, three folders: Auditing, Blocking, and Notifications, representing the most common types of policies enabled by users. You can configure policies to monitor or block Windows Active Directory events, Windows Exchange Server 2010, 2013, 2016, and 2019 events, Windows File System events, NetApp File System events, EMC File System events, and Group Policy Objects events.
You can protect a folder, which controls access to any policy within it. Other Administration Console users can't view, edit, or delete a protected policy without explicit permissions.
Templates
The Templates interface provides a central location for creating and configuring all policy templates. When you select the Templates node, the Display area displays a list of all available policy templates. You must also store policy templates within a folder. You can import pre-created policy templates.
TAGS
The TAGS node provides an organizational feature for templates. Use tags on preconfigured templates to quickly find a template you want through various groupings. Tags don't create a duplicate template, but rather display the template in different folders under the TAGS node.
Status Bar
The Status Bar is located at the bottom of the Administration Console.

It displays the current user account logged into Threat Prevention and current session details.