Data Grid Functionality
Data grids display result data on several interfaces in the Administration Console. These grids employ features for data sorting, filtering, searching, and more.
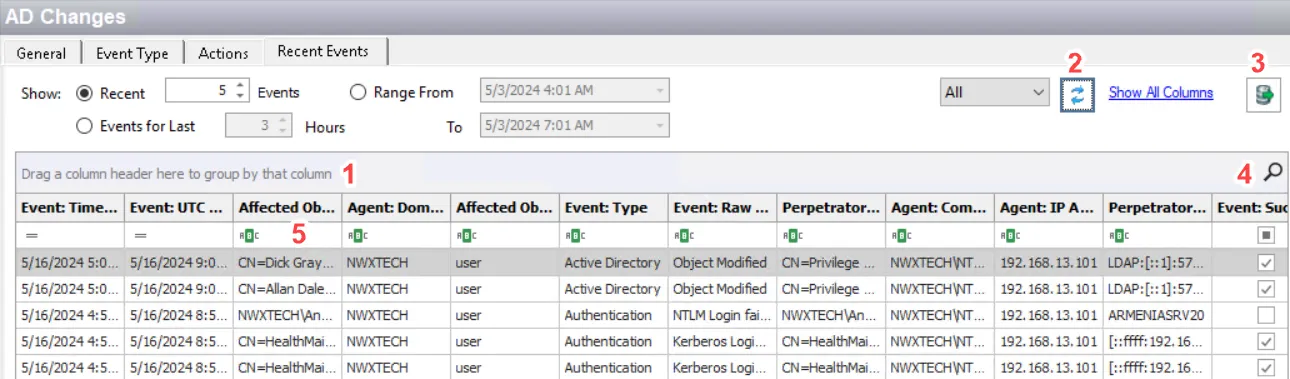
- The Group by Box [1] ribbon impacts how much data the grid displays. See the Sort Data topic for additional information.
- The Refresh [2] button populates the data grid with the current information according to the selections.
- You can reorder columns as desired, as well as remove them from the data grid. You can add removed columns back through the Customization Window.
- Many data grids also contain an Export Data [3] button. This provides different export options with respect to the interface. See the Export Data topic for additional information.
- The Search [4] icon opens the Enter text to search… textbox where you can search for the required data in the data grid. See the Search Data topic for additional information.
- The Auto Filter row [5] uses comparison operators to filter the grid against a single attribute. See the Filter Data topic for additional information.
Customization Window
Right-click a column header and select Column Chooser to open the Customization window, which lists the columns you removed from the data grid display.

You can remove a column from the data grid in any of these ways:
- Drag the column and drop it into this window
- Right click in a column header and select Hide This Column
You can return a column to the data grid by double-clicking it in the Customization window or by dragging it from this window onto the column header row.
Sort Data
You can group data by columns using the Group by Box ribbon above the data grid.
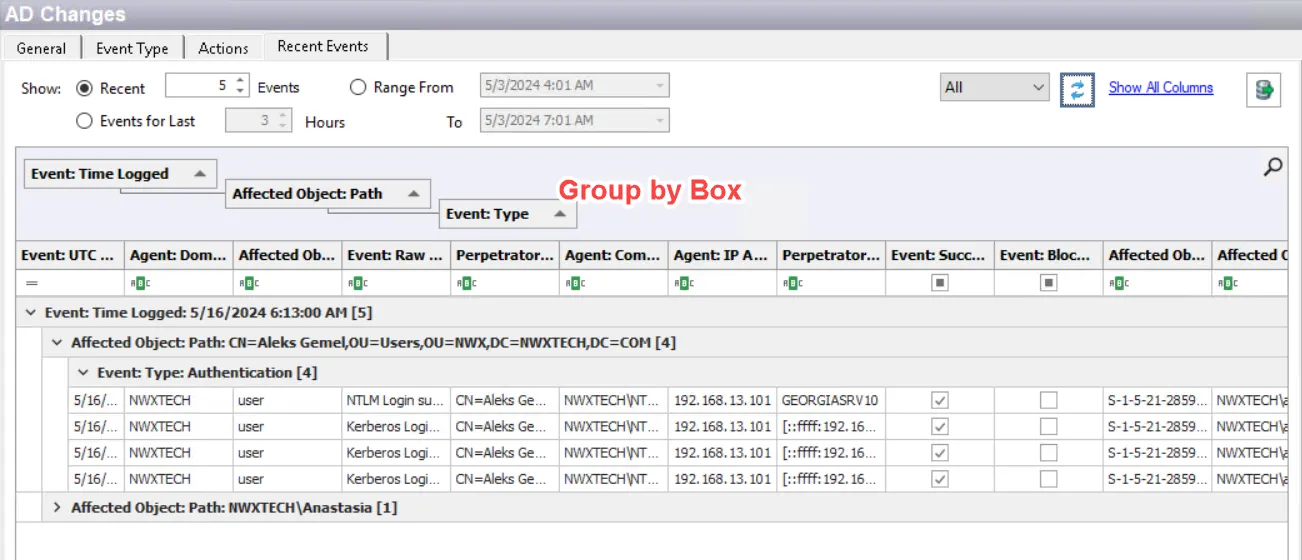
Drag a column header into the Group by Box area to group data from that perspective. You can group by a single header or by tiered headers.
You can also sort data alphanumerically, ascending or descending, by clicking a column header. An arrow displays in the right corner of the column header indicating the type of sorting.
Filter Data
Several methods are available for filtering data in data grids. There can only be one active filter per column.
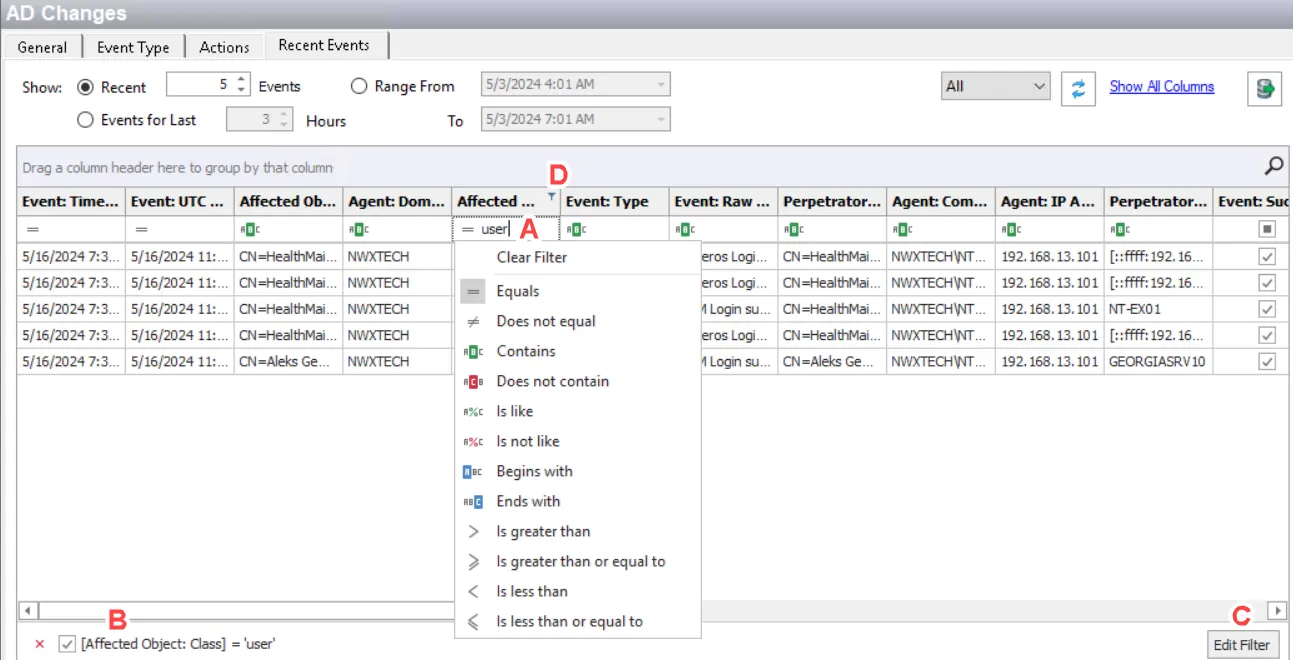
- Auto Filter Row [A] – Uses the comparison operator to filter the grid against a single attribute
- Filter Statement Bar [B] – Displays enabled filter statements at the bottom of the display area
- Filter Editor [C] – Builds complex filter statements with multiple operators and column filters
- Pin Icon [D] – Opens a filtration dialog that provides multiple types of filtration options such as column values, text filters, and date filters associated with the column data
Auto Filter Row
The Auto Filter row is located between the header row and the first event of the data grid. Typing a single attribute in any of these boxes or selecting an attribute from a dropdown menu filters the data grid for matches within that column and the selected comparison operator.
The Alerts grid doesn't display the Auto Filter Row by default. You must select it through the grid's Show Auto Filter Row option from the right-click menu.
Filter Statement Bar
When you enable a filter, the filter statement bar displays at the bottom of the display area. The X to the left of the bar clears the filter. The checkbox for the filter on the left affects the scoping of the filter.
Filter Editor
Notice the Edit Filter option on the right side of the filter statement bar. Click it to open the Filter Editor window, where you can build complex filter statements. It can employ multiple comparison operators and/or multiple column filters.

Pin Icon
A small pin icon displays in the upper-right corner while you hover over a column header, or if you enable an Auto Filter Row filter.
Click the pin icon to open additional filtration options in a filter window. The options displayed depend on the column you open it from.
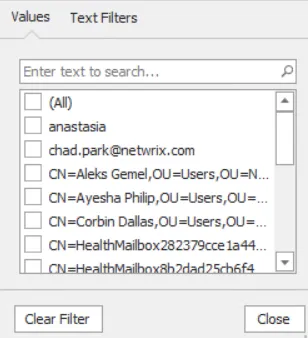
- Values – Displays for every column in the data grid. You can select multiple values.
- Text/Numeric – This is linked to the Auto filter Row filter with the addition of three new filtration options including a custom filter option
- Date – Calendars with date timestamps display this filter with an array of scoping options including a custom filter
- Custom Filter – Found within Text filters, this filter creates an AND or OR statement between two filtered comparison values
Search Data
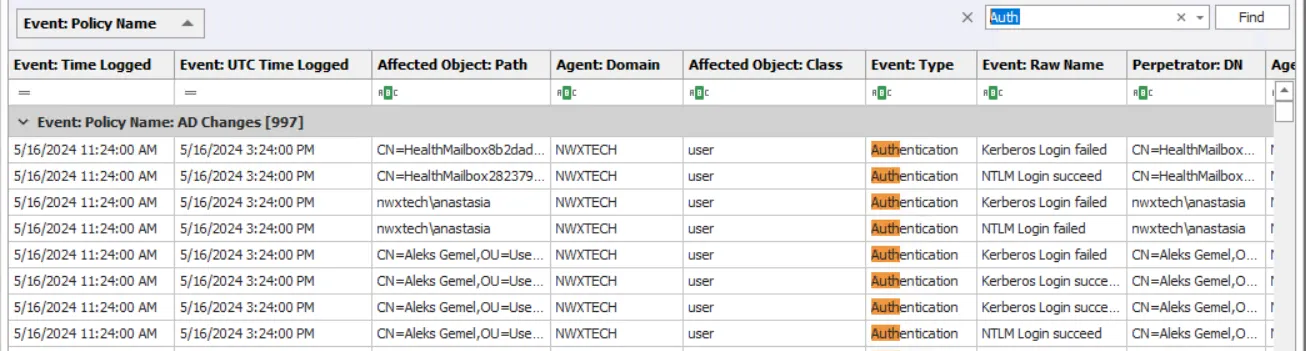
Use the Find Panel to search for data in the data grid. A magnifying glass icon represents it. It displays by default, but you can choose to hide or show it using the Show/Hide Find Panel option on the Data Grid Right-Click Menu.
When you click the magnifying glass icon, the Find box appears as follows:

- Enter search criteria and click Find. The data grid filters to events that match the search criteria, highlighting the match.
- The dropdown arrow in the textbox provides a history of recent searches for quick reference.
- Click Clear to clear both the search criteria and the filtered view.
- The X at the far left of the panel closes the Find Panel.
Export Data
The data grids provide an option to export data.
- Data grids on the Agents interface and on the Analytics windows export all available data from the grid to a CSV file. Clicking the Export button from these interfaces opens a Save As window.
- Clicking the Export button from the Alerts interface opens the Alerts Export window. See the Alerts Export Window topic for additional information.
- Clicking the Export button from the Investigate interface or the Recent Events tab of a policy opens the Export window.
Ensure you set the filters you want on the data grid before export.

The Export window provides options for what to export and what actions to take.
In the Export options section, select the option buttons for the Columns and Rows subsections.
- For Columns, you can export data displayed in Visible Columns Only or for All Columns. See the Customization Window topic for details on selecting what columns are visible in a data grid.
- For Rows, the exported data can show All Rows or Filtered Only.
In the Export Actions section, select where to export data. Check the boxes for Save File Locally and/or Email to and populate the required fields.
- For the Save File Locally action, a Save As window displays when you click Export. Use the default path and file name to save the CSV file or choose another one. Then click Save.
- For the Email to action, provide an email address for each recipient, which can be individuals, distribution lists, or a combination. Use either a comma (,) or a semi-colon (;) to separate multiple recipients. Click Export to export the data.
The Email to action requires you to configure the SMTP host information. Only a Threat Prevention administrator can do this, through the Email Tab of the System Alerting window.