Summary Folders
The EPE Summary and LDAP Summary folders under Investigate in the navigation pane are pre-defined reports. Use them to view consolidated recent event activity for EPE or LDAP which spans all EPE or LDAP policies. The reports include default groupings that best show the consolidated data.
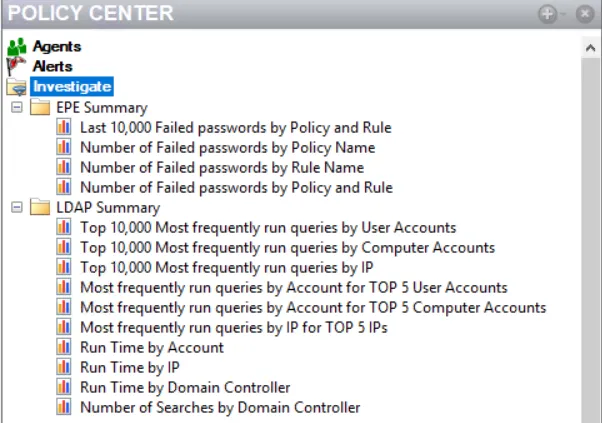
The investigate summary folders have the following reports:
- EPE Summary
- Last 10,000 Failed passwords by Policy and Rule
- Number of Failed passwords by Policy Name
- Number of Failed passwords by Rule Name
- Number of Failed passwords by Policy and Rule
- LDAP Summary
- Top 10,000 Most frequently run queries by User Accounts
- Top 10,000 Most frequently run queries by Computer Accounts
- Top 10,000 Most frequently run queries by IP
- Most frequently run queries by Account for TOP 5 User Accounts
- Most frequently run queries by Account for TOP 5 Computer Accounts
- Most frequently run queries by IP for TOP 5 IPs
- Run Time by Account
- Run Time by IP
- Run Time by Domain Controller
- Number of Searches by Domain Controller
Click a report to view it.
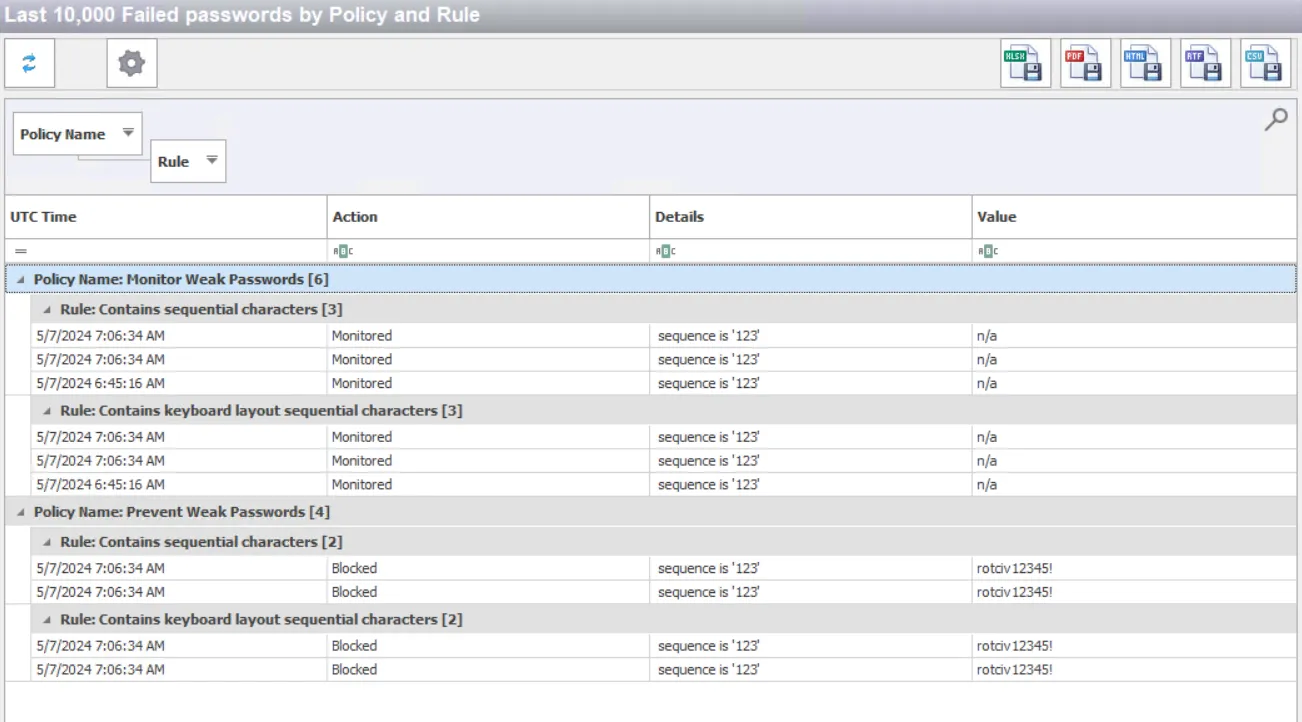
By default, the data grid is blank. Select Refresh to display results on the data grid.
The grid view displays columns associated with the scope of the report. If there is no data available, the grid doesn't populate but the columns display on the grid. The following buttons are available below the report name:
- Refresh – Repopulates the data grid with the current information for the selected report
- Configure – Opens the Parameters window. Set the optional time range as well as the type of policies.
- Export – Export the selected report to an Excel, PDF, HTML, RTF, or CSV output. The Save As window displays when you select an export option. Provide a name for the report and save to a specified location.
Parameter Window

The Parameters window displays the following options. Select the options you want and click OK to display data in the report accordingly.
-
Range From/To – If left unchecked, the report displays all policy data. When enabled, set a data range for the data to display in the report using the To and From dropdown calendars. By default, the calendar displays today's date. Click OK to set the date and time.
For faster navigation on the calendar, select the month to display all twelve months to choose from. After the months display, select the year to display a range of years to choose from.
-
Policies – Choose All or Enabled Only to display all policies or enabled only policies in the report
-
Events – Select All, Blocking, and/or Monitoring events to display in the report