Investigate Filters
On the Investigate Interface, you can apply six filter categories to the recent events available in the data grid. By default, Threat Prevention applies no filters. For the Policy filter, Threat Prevention selects all enabled unprotected policies and any protected policies the current user has rights to view, and leaves the other filter categories blank. You can apply filters using any combination of the filter categories. Use the Refresh button to repopulate the data grid with the current information for the selected filters.
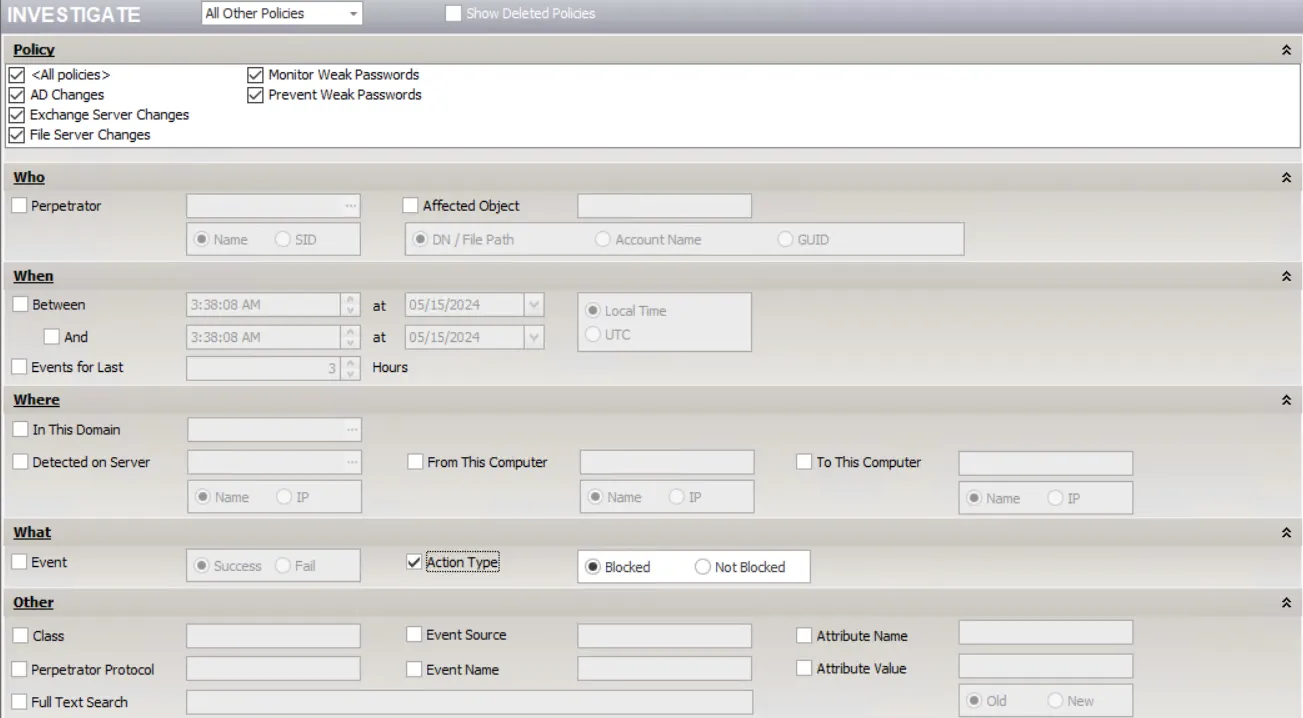
The following sections discuss each filter category.
Policy
To filter by Policy, check the checkboxes for the policies you want. Threat Prevention grays out protected policies that the current user doesn't have rights to view.
- All policies – Toggles on or off all available policies
- Show Deleted Policies – Displays previously deleted policies in the Policy filter category, and includes them in the filter. By default, investigation results don't include event data from deleted policies.
Who
To filter by Who, check the Perpetrator box to filter for a particular security principal committing the change and/or check the Affected Object box to filter for a particular object being affected by a change.
For the Perpetrator option, select the option button for either:
- Name – Identify a perpetrator by name
- SID – Identify a perpetrator by the Security Identifier
Then enter the who in the textbox or use the ellipsis (…) to open the Available Perpetrators window that displays perpetrators known within the database.
For the Affected Object option, select the option button for either:
- DN / File Path – Identify an object by the distinguished name or file path
- Account – Identify an object by the SAM account name
- GUID – Identify an object by the globally unique identifier
Then enter the who in the textbox. Filter criteria can be a partial match.
When
Filtering by When provides several options, including the option between using Local Time or UTC time.
- To filter from a specified date and time to the present, check the Between box and set the start time and date
- To filter for everything before a specified date and time, check the And box and set the end time and date
- To filter for a specific time frame, check both the Between and And boxes, then set the start and end times
- To filter for Events for Last [number] Hours, check this box and set the number of hours to use as the filter
Where
To filter by Where, check the box(es) for the filter types you want:
- In this Domain – Enter the [domain name] in the textbox or use the ellipsis (…) to open the Available Domains window that displays domains known within the database.
- Detected on Server – Select the radio button for either Name or IP and then enter the server in the textbox. You can use the ellipsis (…) to open the Available Servers window that displays servers known within the database.
- From This Computer – Select the radio button for either Name or IP and then enter the computer in the textbox
- To This Computer – Select the radio button for either Name or IP and then enter the computer in the textbox
Filter criteria can be a partial match
What
To filter by What, check the box(es) for the filter types you want:
- Event – Select the option button for either Success or Fail
- Action Type – Select the option button for either Blocked or Not Blocked
Other
To filter by Other, check the box(es) for the filter types you want:
- Class
- Perpetrator Protocol
- Event Source
- Event Name
- Attribute Name
- Attribute Value – Select the option button for either Old or New and then enter the old or new value in the box
Filter criteria can be a partial match.
The Full Text Search doesn't use indexes. Unless you select other indexed criteria, the full text search could result in a scan of the entire SQL database, which could be very slow for large databases.
- Full Text Search – Queries the entire SQL database for the entered attribute. If the attribute displays anywhere in the event, it appears in the data grid.
Click the arrow on the filter category header ribbon to expand or collapse the category. You can also clear all filters by clicking the Reset Filters button on the ribbon between the filter categories and the data grid. You can also save filtered views. See the Saved Investigations topic for additional information.