SIEM Output Viewer
The SIEM Output Viewer window displays the event data (messages) that Threat Prevention writes to syslog (SIEM) in real time.
- Threat Prevention sends event data generated for a policy to SIEM if you select the 'Send to SIEM' option for that policy on the Actions tab. See the Send to SIEM topic for additional information.
- Threat Prevention sends event data generated for an analytic to SIEM if you select the 'Send Raw Data to SIEM' option for that analytic on the Actions tab. See the Send to SIEM topic for additional information.
- Threat Prevention sends event data generated for an event/incident/policy to SIEM if you assign a SIEM profile to it on the SIEM Tab of the System Alerting Window.
While you can also use third-party tools like Kiwi Syslog Server to view the output, the SIEM Output Viewer window may serve as a troubleshooting tool to view and verify the actual data Threat Prevention sends to syslog (SIEM) in real time.
Step 1 – Click Configuration > SIEM Output Viewer on the menu; the SIEM Output Viewer window opens. This window is only available to Threat Prevention administrators.
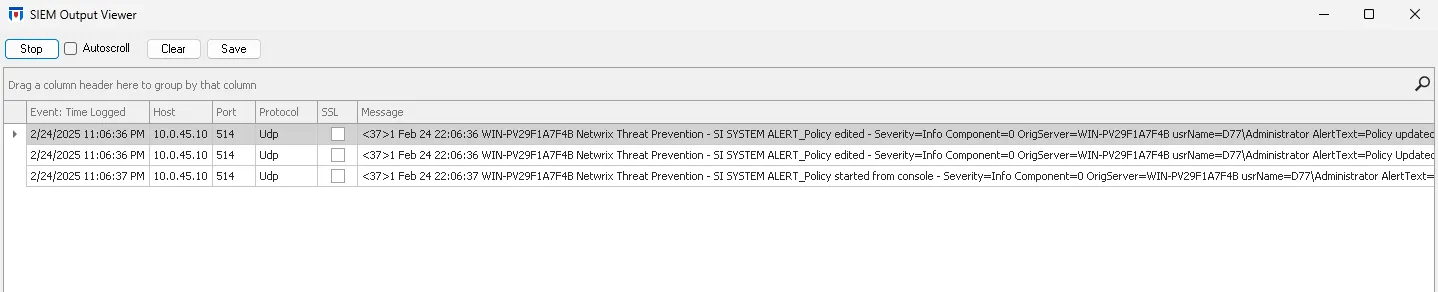
Step 2 – Click Start. As events occur and Threat Prevention writes to syslog (sends event/policy/analytics data to SIEM) in real time, the window displays them.
Step 3 – The Autoscroll checkbox enables or disables automatic scrolling of the log display.
- When enabled, the SIEM Output Viewer window automatically scrolls down to show the latest incoming messages in real time.
- When disabled, you will have to manually scroll and review log entries without the display automatically jumping to the newest message.
Step 4 – For each message, the SIEM Output Viewer window displays the following:
- Event: Time Logged – Timestamp for when Threat Prevention monitored or blocked the event. The specified time is the local time for the server where the Agent is deployed. Hover over the data in this column to view the local time (of the Enterprise Manager) and UTC time simultaneously.
- Host – The IP address or name of the SIEM server, configured in the SIEM server settings
- Port – The port number to communicate with the SIEM server, configured in the SIEM server settings
- Protocol – The protocol set when configuring the SIEM server, i.e., TCP or UDP
- SSL – Shows whether SSL is used when sending data to SIEM (applies if TCP is set as the protocol)
- Message – The actual data sent to syslog
- Status – This field is empty if Threat Prevention successfully sends the message. Otherwise, it contains the text of the error it received, for example, 'Connection timeout'
You can select a row and use Ctrl+C to copy the data displayed in it. Then paste it to another application like Notepad to examine it in detail.
The host, port, protocol, and SSL columns display the settings configured for the SIEM server where the respective message is sent. See the Configure a SIEM Server topic for additional information.
This data grid employs features for sorting, filtering, searching, and more.
- Right-click anywhere in the column header to get a menu with several options to sort the data in the grid. See the Data Grid Right-Click Menu topic for additional information.
- The Group by Box ribbon just above the header row impacts how much data is displayed. See the Sort Data topic for additional information.
- Columns can be reordered as desired as well as removed from the data grid. Removed columns can be added back through the Customization Window.
- The Search icon opens the Enter text to search… textbox where you can search for the required data in the data grid. See the Search Data topic for additional information.
Step 5 – Click Save to save the displayed data to a text file or Clear to clear the data.
When you click Save, the Save As dialog box opens, where you can select a location to save the text file.