GPO Monitoring Dashboard
The GPO Monitoring dashboard contains the following cards:
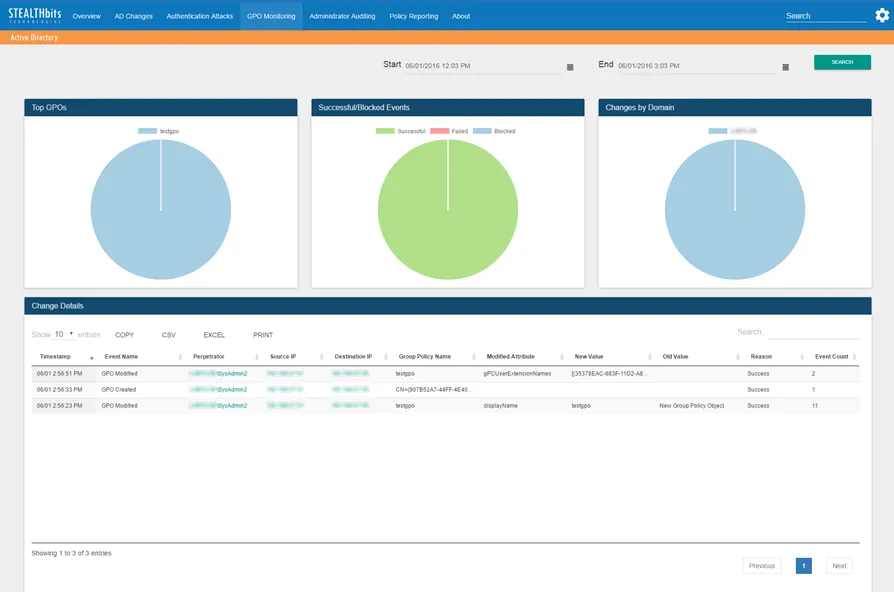
- Top GPOs – Shows the top five Group Policy Objects associated with events in the specified timeframe. See Graph Card Features for details.
- Successful/Blocked Events – Breakdown of Group Policy Object changes by successful, failed, or blocked status in the specified timeframe. See Graph Card Features for details.
- Changes by Domain – Breakdown of Group Policy Object changes by domain in the specified timeframe. See Graph Card Features for details.
- Change Details – Tabular format of all Group Policy Object change events in the specified timeframe. See Table Card Features for details.
The time interval is identified in the upper-right corner in the Start and End boxes, which default to the past three hours. To search a different timeframe, enter the start and end dates and times, or use the calendar buttons to select them. Click Search to refresh the card data.
Searches using a time interval longer than 12 hours split the database query into multiple mini-queries. The dashboard display resets at the end of each mini-query until all data for the selected timeframe is retrieved.