Administrator Auditing Dashboard
The Administrator Auditing dashboard is specifically fed by a Threat Prevention policy named Domain Admin Activity. See the SIEM Folder Templates topic for information on this policy template. The dashboard is blank if this policy template isn't enabled and monitoring.
The Administrator Auditing dashboard contains the following cards:
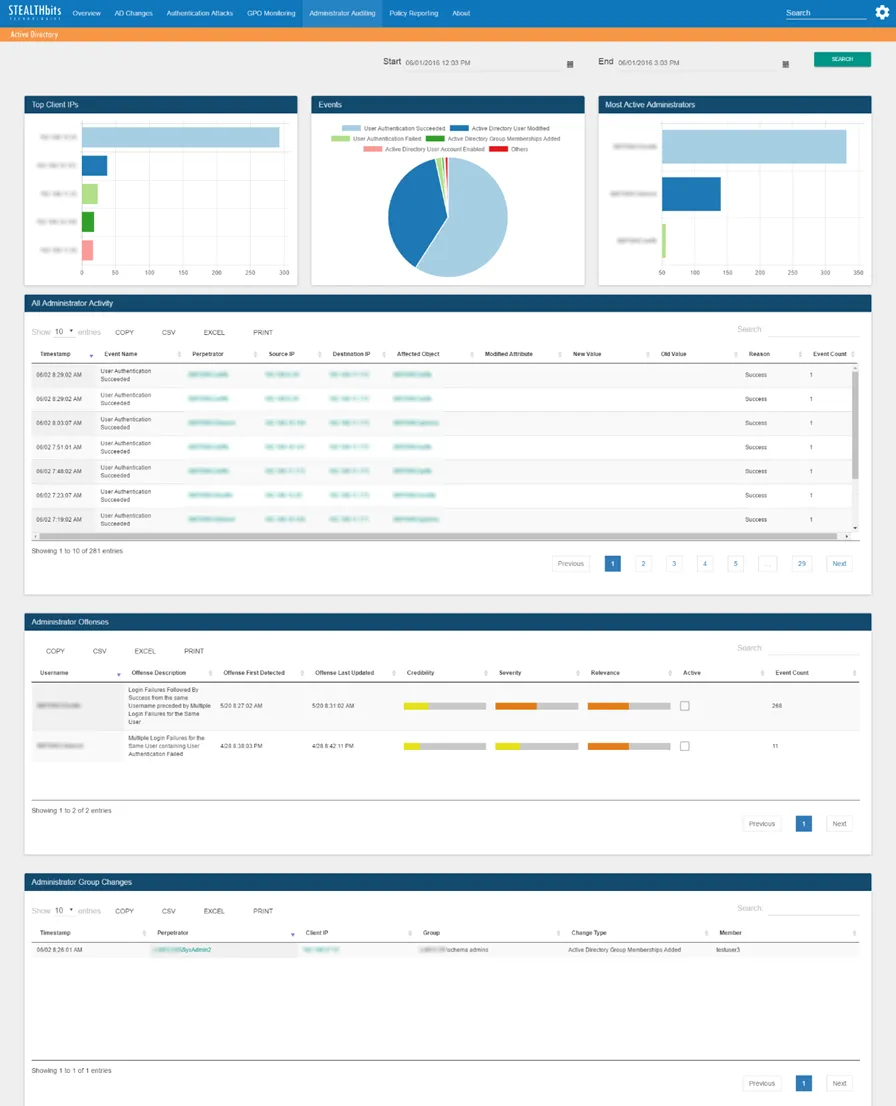
- Top Client IPs – Shows the top five client IP addresses associated with events in the specified timeframe
- Events – Breakdown of changes by successful, failed, or blocked status in the specified timeframe. See Graph Card Features for details.
- Most Active Administrators – Shows the top five usernames associated with change events in the specified timeframe
- All Administrator Activity – Tabular format of all events in the specified timeframe. See Table Card Features for details.
- Administrator Offenses – Tabular format of all offenses related to Administrators. See Table Card Features for details.
- Administrator Group Changes – Tabular format of all group changes to the Domain, Schema, and Enterprise Admin groups in the specified timeframe. See Table Card Features for details.
The time interval is identified in the upper-right corner in the Start and End boxes, which default to the past three hours. To search a different timeframe, enter the start and end dates and times, or use the calendar buttons to select them. Click Search to refresh the card data.
Searches using a time interval longer than 12 hours split the database query into multiple mini-queries. The dashboard display resets at the end of each mini-query until all data for the selected timeframe is retrieved.