Policy Reporting Dashboard
The Policy Reporting dashboard is for viewing Threat Prevention events from any enabled policy that is sending events to Splunk. The Policy drop-down menu in the upper-left corner of the dashboard will be populated with all the enabled Threat Prevention policies sending event data to Splunk in alphanumeric order. On selecting a policy, the dashboard cards will load the event data from that policy.
The Policy Reporting dashboard contains the following cards:
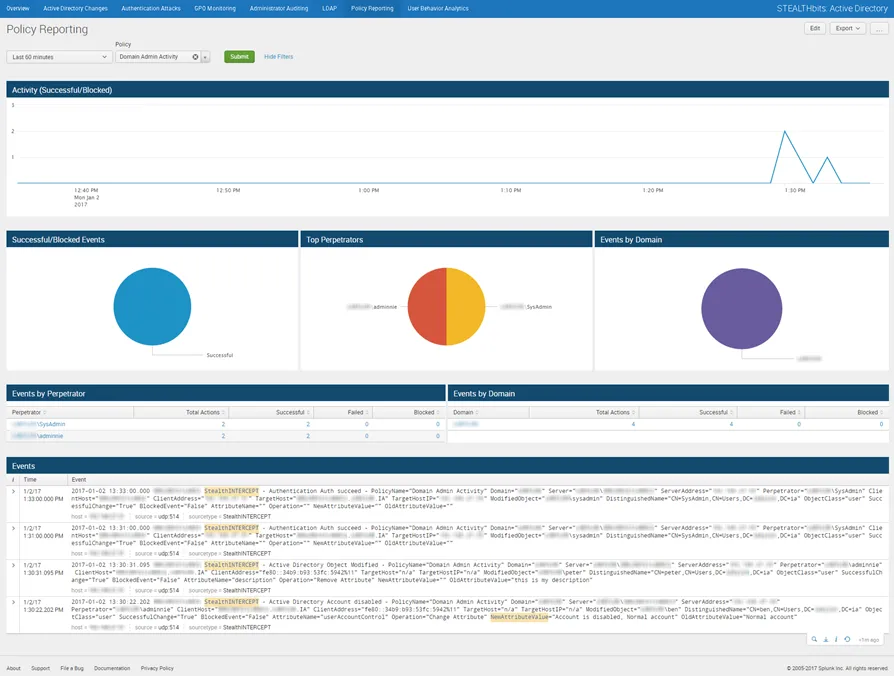
- Activity (Successful/Blocked) – Timeline of successful/failed/blocked events related to the selected policy that have been recorded in the specified timeframe
- Successful/Blocked Events – Breakdown of events related to the selected policy that have been recorded in the specified timeframe by successful/failed/blocked status
- Top Perpetrators – Displays up to the top five (5) usernames related to the selected policy that have been recorded in the specified timeframe
- Events by Domain – Breakdown of events related to the selected policy that have been recorded in the specified timeframe by domain
- Events by Perpetrator – Tabular format of all usernames related to the selected policy for events that have been recorded in the specified timeframe
- Events by Domain – Tabular format of all domains related to the selected policy for events that have been recorded in the specified timeframe
- Events – Tabular format of all events related to the selected policy that have been recorded in the specified timeframe
The specified timeframe is set by default to the last 24 hours, or past day.