Dashboard Guide
Dashboard Guide
Dashboard Guide
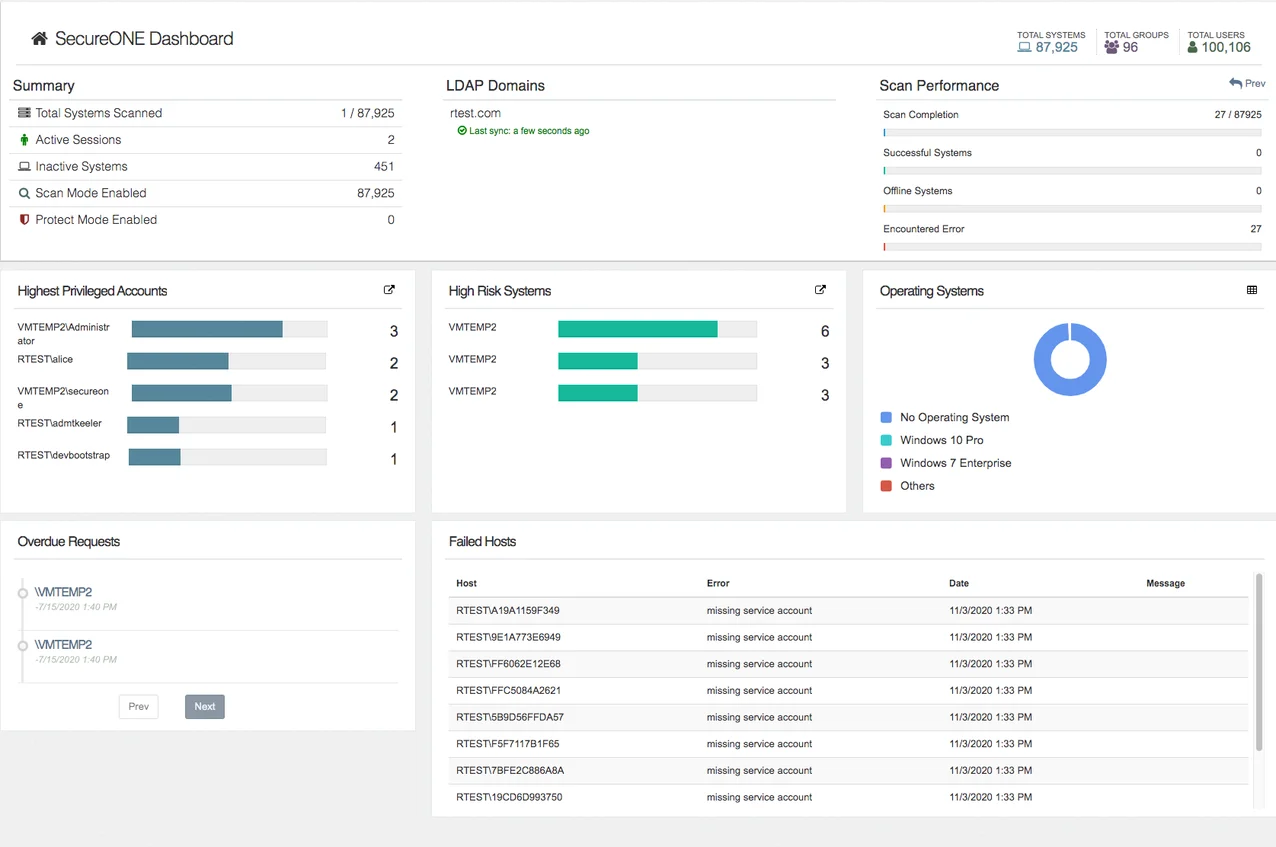
What do these numbers mean? Where do they come from? Let’s find out.
The queries made to the API are listed here along with which parts of the Dashboard they populate.
-
Summary | Total Systems Scanned (the total part, after the slash, aka denominator)
-
The total number of Computer objects that we have in ldap_store
-
contrast this number with Summary | Scan Mode Enabled, which is the number of system that we would attempt to scan.
-
Summary | Total Systems Scanned (the scanned part, before the slash, aka numerator)
-
count of systems that we attempted to scan on this run
-
Scan Performance | Encountered Error
-
count of systems that had a connection error or some other unhandled exception
-
Scan Performance | Scan Completion
-
Scan Performance | Offline Systems
-
count of systems that were offline at the time of scan
-
Scan Performance | Successful Systems
-
count of systems that were successfully reached and scanned
Systems where we were unable to Verify that the correct host was reached (VerifyHostError) don’t appear to be accounted for in the dashboard.
-
Summary | Inactive Systems
-
Computer objects with a lastLogonTimestamp older than 90 days.
-
Overdue Requests
-
Access requests that are more than 2 minutes overdue (i.e. access requests that marked to be expired more than 2 minutes ago)
-
Failed Hosts
-
Systems that have a lastScan.success set to false. In other words, systems that we could not successfully scan for some reason on the more recent scan attempt.
-
Note that systems that are no longer set to be scanned but previously failed to scan are still counted here.
-
This should not include systems that have not already been scanned (e.g. systems newly added from ldapsync)
-
Highest Privileged Accounts
-
Users who are able to reach the most systems to gain admin access.
-
Descending sort on the FlattenedAdminsUserStats collection
-
LDAP Domains
-
names of all configured LDAP connections
-
High Risk Systems
-
Systems that have the largest number of users who could request admin access.
-
Descending sort of the current FlattenedAdmin
-
Summary | Active Sessions
-
number of JITA sessions that are active and the time is ticking down towards expiration.
-
Summary | Scan Mode Enabled
-
number of systems with the scan policy set to true
-
Summary | Protect Mode Enabled
-
number of systems with protect mode set to true.