PolicyPak Cloud Event Forwarding to Splunk
PolicyPak Cloud no longer includes this functionality as of version 25.8.4354.
Netwrix PolicyPak Cloud customers can store one day of PolicyPak Least Privilege Manager logs in PolicyPak Cloud for free. If your PolicyPak Cloud tenant doesn't have this enabled yet, open a ticket with PolicyPak Support.
PolicyPak Cloud customers who need more than one day of storage must pay a fee.
As an alternative, customers can use the free PolicyPak Cloud Event Forwarding to Splunk mechanism.
Configure event forwarding to Splunk
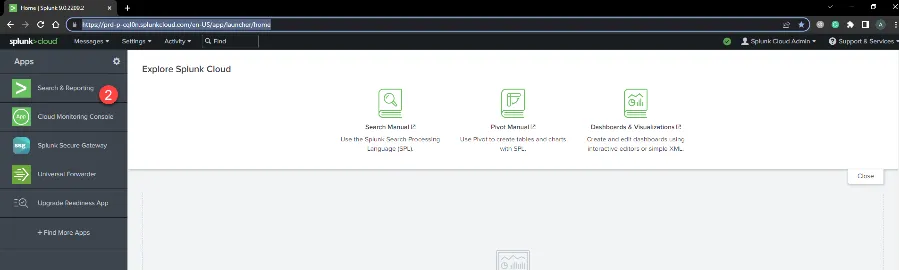
Step 1 – Log in to login.splunk.com and get your URL. You also need your Splunk Access Token (https://docs.splunk.com/observability/en/admin/authentication-tokens/api-access-tokens.html and https://docs.splunk.com/Documentation/Splunk/9.1.1/Security/Setupauthenticationwithtokens ). You will need both the URL and API Token during these steps.
These directions send data to Splunk Cloud, but the process is similar to on-prem Splunk. Configure your on-prem Splunk to accept data sources from the Internet.
Configure Event Forwarder in PolicyPak Cloud
Step 2 – Navigate to https://cloud.policypak.com/, go to Company details > Event Forwarder List > Add Event Forwarder .
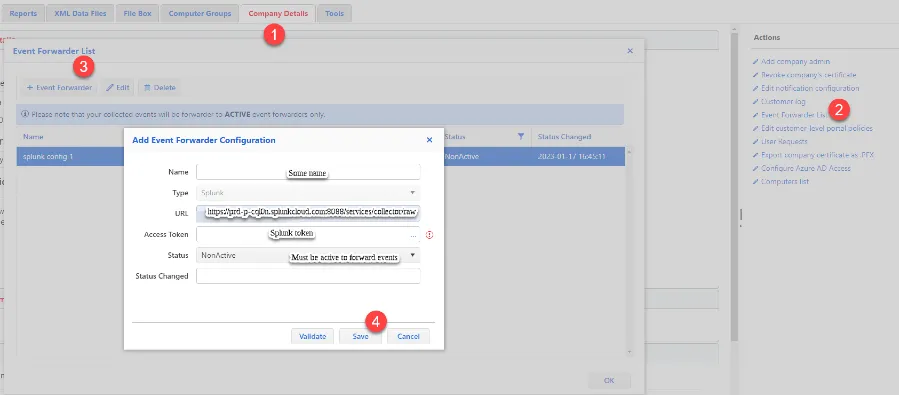
Step 3 – Configure and save the new Event Forwarder. You must be a member of the Notification Option Admin role. For extra security, saving the Event Forwarder configuration requires a one-time password.
You can use the Validate button to check the credentials before saving.
Step 4 – Check the forwarding events state in the Collected Events report.
Step 5 – In PolicyPak Cloud, confirm that event forwarding works as expected.
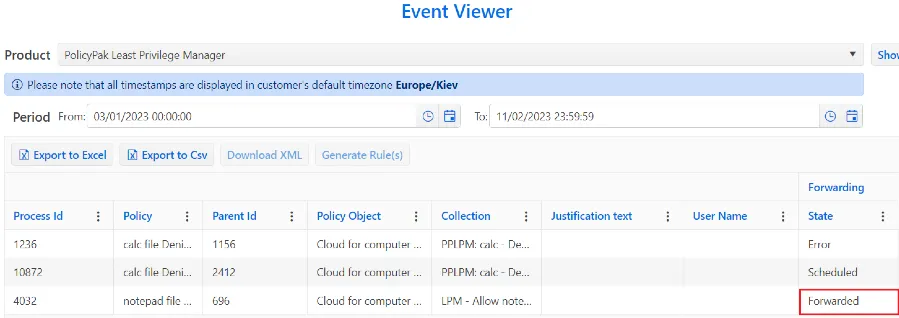
Step 6 – In PolicyPak Cloud, go to Report > Computers (Collected Events) > Show event, and check Forwarded state (Scheduled, Forwarded, Error).
Step 7 – View the forwarded events in Splunk..
Step 8 – To confirm the events appear in Splunk, navigate to Splunk Home and enter the user name and password.
Step 9 – Click Search & Reporting enter index=history filter, then click the Search icon.
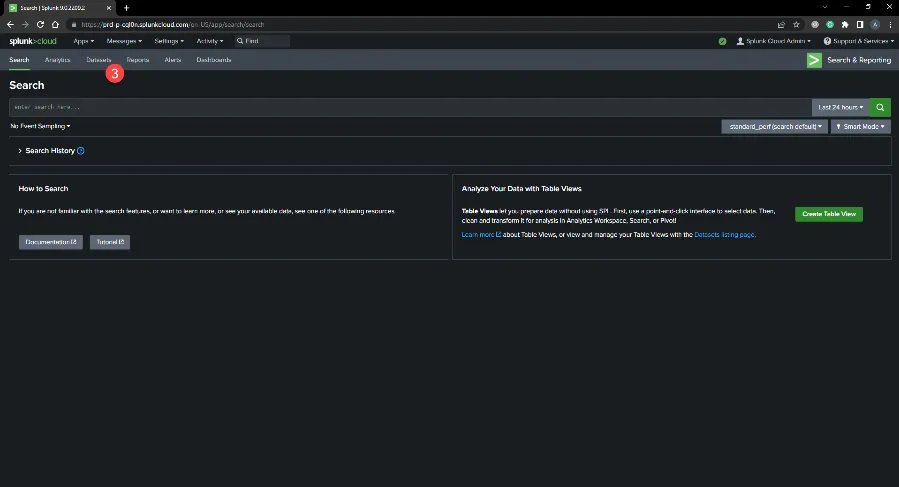
Step 10 – Click Datasets.
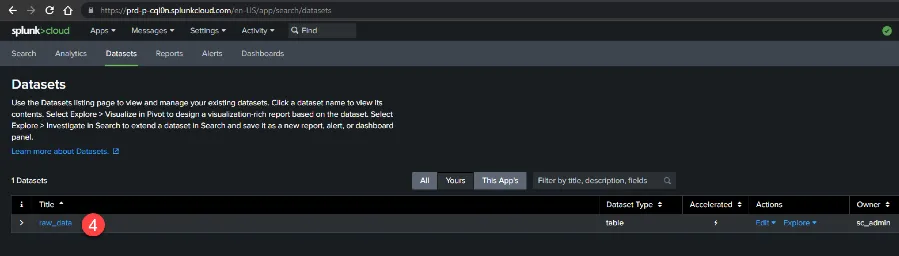
Step 11 – Click raw_data.
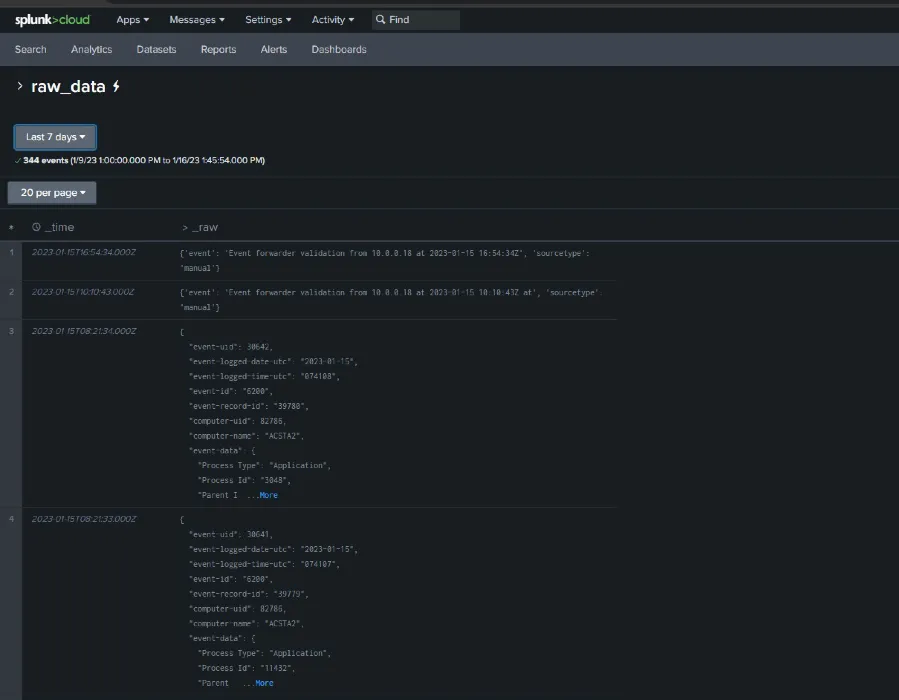
Step 12 – View the event data