Content Distribution Map
The Content Distribution treemap lets you interrogate your data in two different ways:
- Taxonomy Grouping—When grouped by taxonomy, the treemap highlights the sources with the largest numbers of documents tagged to the selected taxonomies / terms. An example use case is when detecting sensitive documents—in this case the treemap shows the highest risk sources. Clicking on an area drills into the term / taxonomy to provide a clear view of the affected sources. You can optionally exclude "safe" sources, such as quarantine locations.
- Source Grouping—When grouped by source, the treemap shows the level of content either untagged or tagged within the taxonomy. The treemap displays the top level terms for the selected taxonomy with the counts including any document tagged to either the top level term or one of its descendants. A document can carry one or more terms, so the number associated with each top level term may exceed the number of documents in the source.
Filter and refine this display by selecting specific sources / source-groups or excluding specific sources / source-groups.
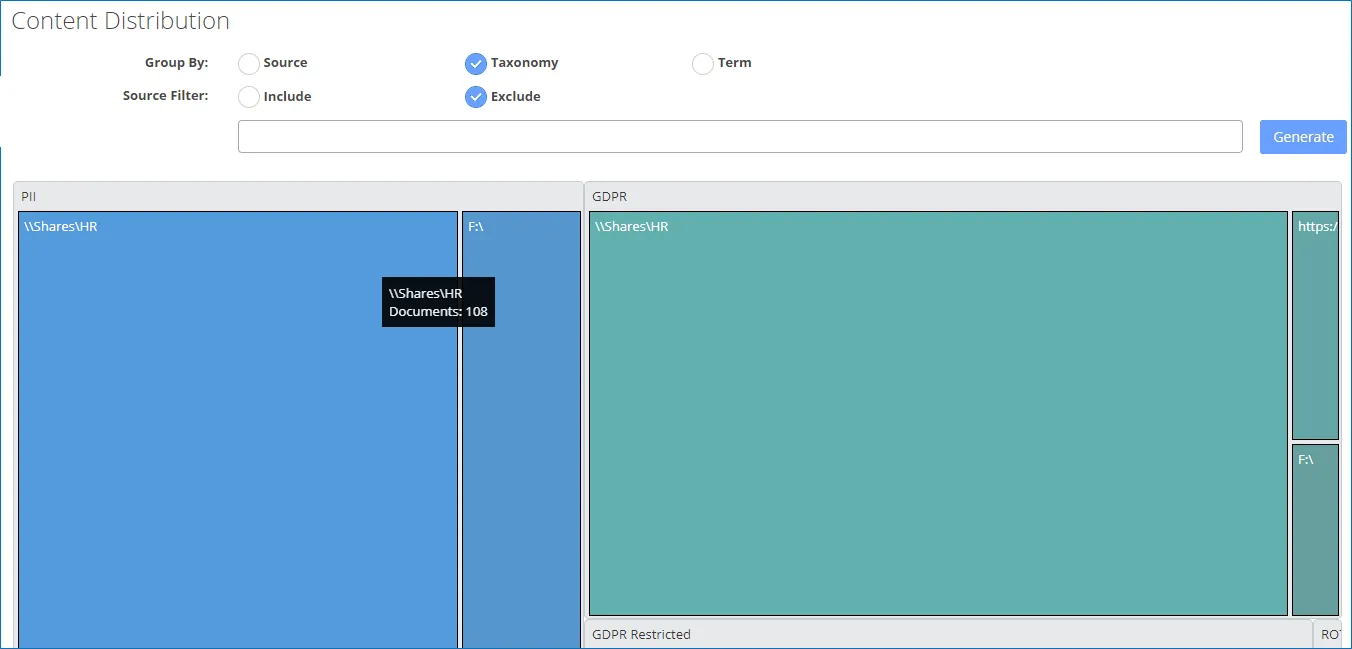
You can zoom in to a particular area of the chart by left-clicking in that area; left clicking on the title lets you export that node. Right-clicking zooms back out again.