Top Reports and Charts
Several reports and charts are listed at the top of the list because they provide the most frequently requested information:
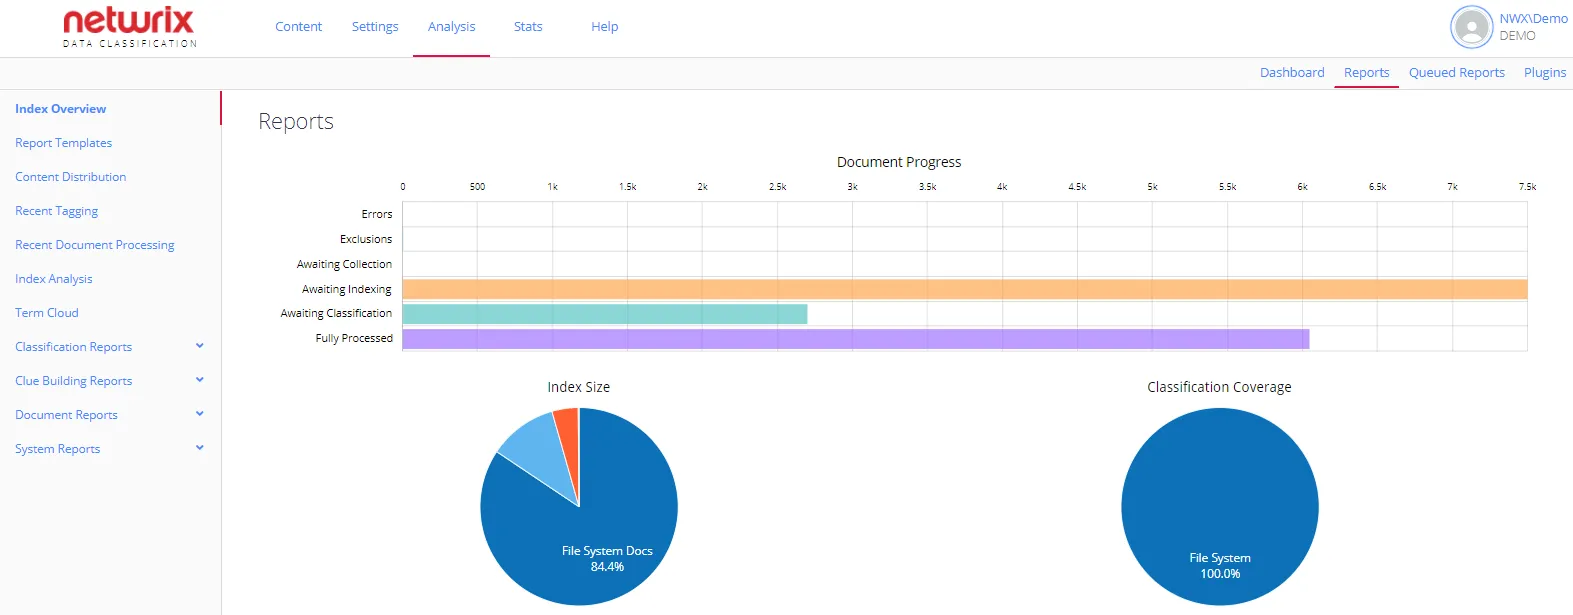
- Dashboard—Shows a high level overview of Netwrix Data Classification operations statistics.
- Content Distribution —View the distribution of your content in several formats: grouping by source, grouping by taxonomy, or grouping by term. See Content Distribution Map for details.
- Recent Tagging—Displays statistics on the tagging results according to the specified filters. To view this data, ensure the "Auto-Classification Change Log" feature is enabled. See the preceding section for more details.
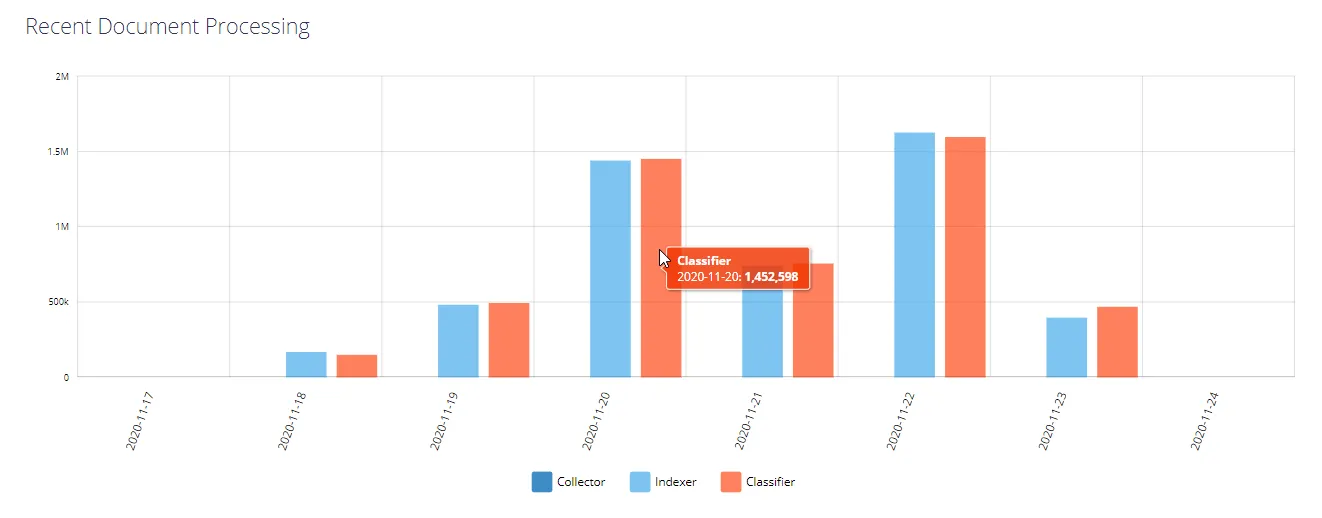
- Recent Document Processing—Displays statistics on the document processing results for the last 7 days. This includes collection, indexing, and classification of data in the content sources.
- Index Analysis—Lets you manually queue items for background index analysis, initially scoped to assist in identifying fuzzy matched duplicate documents.
- Term Cloud—Displays the top 50 key terms/phrases across the index, selecting a term expands the cloud into the related terms.