Reporting
The Reports administration area helps a user extract a wealth of information from the index.
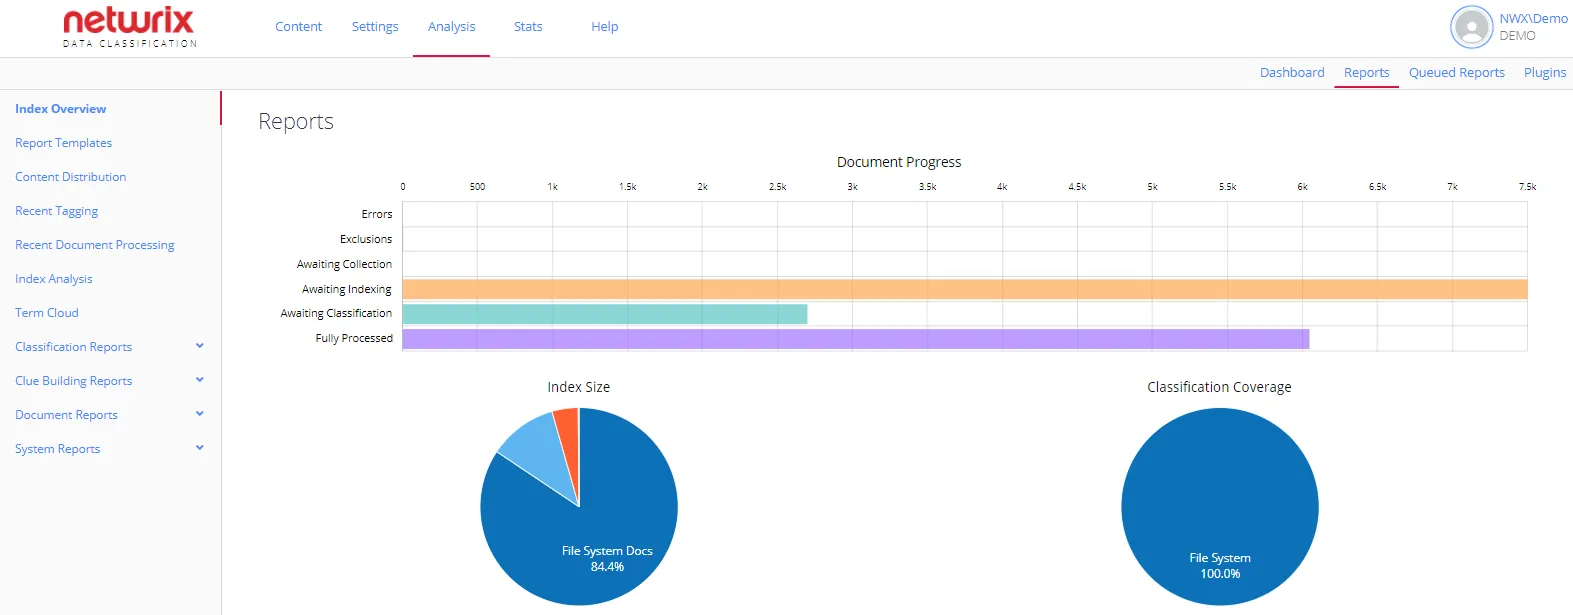
The main dashboard has three high level graphs highlighting the current state of processing:
- Document Progress – A graphical display of the main stats display; once processing completes, documents are either “Fully Processed” or in “Errors”
- Index Size – Shows the percentage of each source type being processed: Files, SharePoint, SQL, and Web sources
- Classification Coverage – Shows the percentage of classified content, broken down by type, and the percentage of content that has not received any auto-classifications:
The Classification Distribution graph highlights areas of classification overlap. In the preceding example the classification “Communications” has been found to be the most highly scoring term that overlaps on all 3 of the site collections displayed. However, the classification “Data” applies very strongly to the “2013” site collection.
You can filter and refine this display to look for the areas containing the most documents tagged with a particular term, or to review only specific content.