SQL Server
NOTE: Prior to configuring your monitoring plan, please read and complete the instructions in the following topics:
-
Protocols and Ports Required – To ensure successful data collection and activity monitoring configure necessary protocols and ports for inbound and outbound connections
-
Data Collecting Account – Configure data collecting accounts as required to audit your IT systems
-
SQL Server – Configure data source as required to be monitored
To configure SQL Server data source settings, use the following property tabs:
When finished, review your data source settings and click Add to go back to your plan. The newly created data source will appear in the Data source list.
As a next step, click Add item to specify an object for monitoring. See the Add Item to the SQL Server topic for additional information.
General settings
On the General tab, you can configure the following settings for SQL Server data source:
| Option | Description |
|---|---|
| General | |
| Monitor this data source and collect activity data | Enable monitoring of the selected data source and configure Auditor to collect and store audit data. |
| Monitor SQL Server configuration changes | Always enabled, as SQL Server configuration changes are always monitored. |
| Monitor SQL Server logon activity | Specify what types of logon events you want to monitor: successful or failed, performed through Windows and SQL authentication. - Failed SQL and Windows logons - Successful SQL logons - Logoffs - Successful Windows logons |
| Collect data for state-in-time reports | Configure Netwrix Auditor to store the snapshots of your SQL Server instance configuration — you will require them for state-in-time reports generation. See State–In–Time Reports for more information. CAUTION: The State-in-Time functionality is not available for SQL Server Availability Groups. The product updates the latest snapshot on the regular basis to keep users up-to-date on actual system state. Only the latest snapshot is available for reporting in Netwrix Auditor. If you want to generate reports based on different snapshots, you must import snapshots to the Audit Database. To import snapshots, you must be assigned the Global administrator or the Global reviewer role in Netwrix Auditor. 1. In the Manage historical snapshots section, click Manage and select the snapshots that you want to import. 2. Move the selected snapshots to the Snapshots available for reporting list using the arrow button. 3. When finished, click OK. See also Using historical data. |
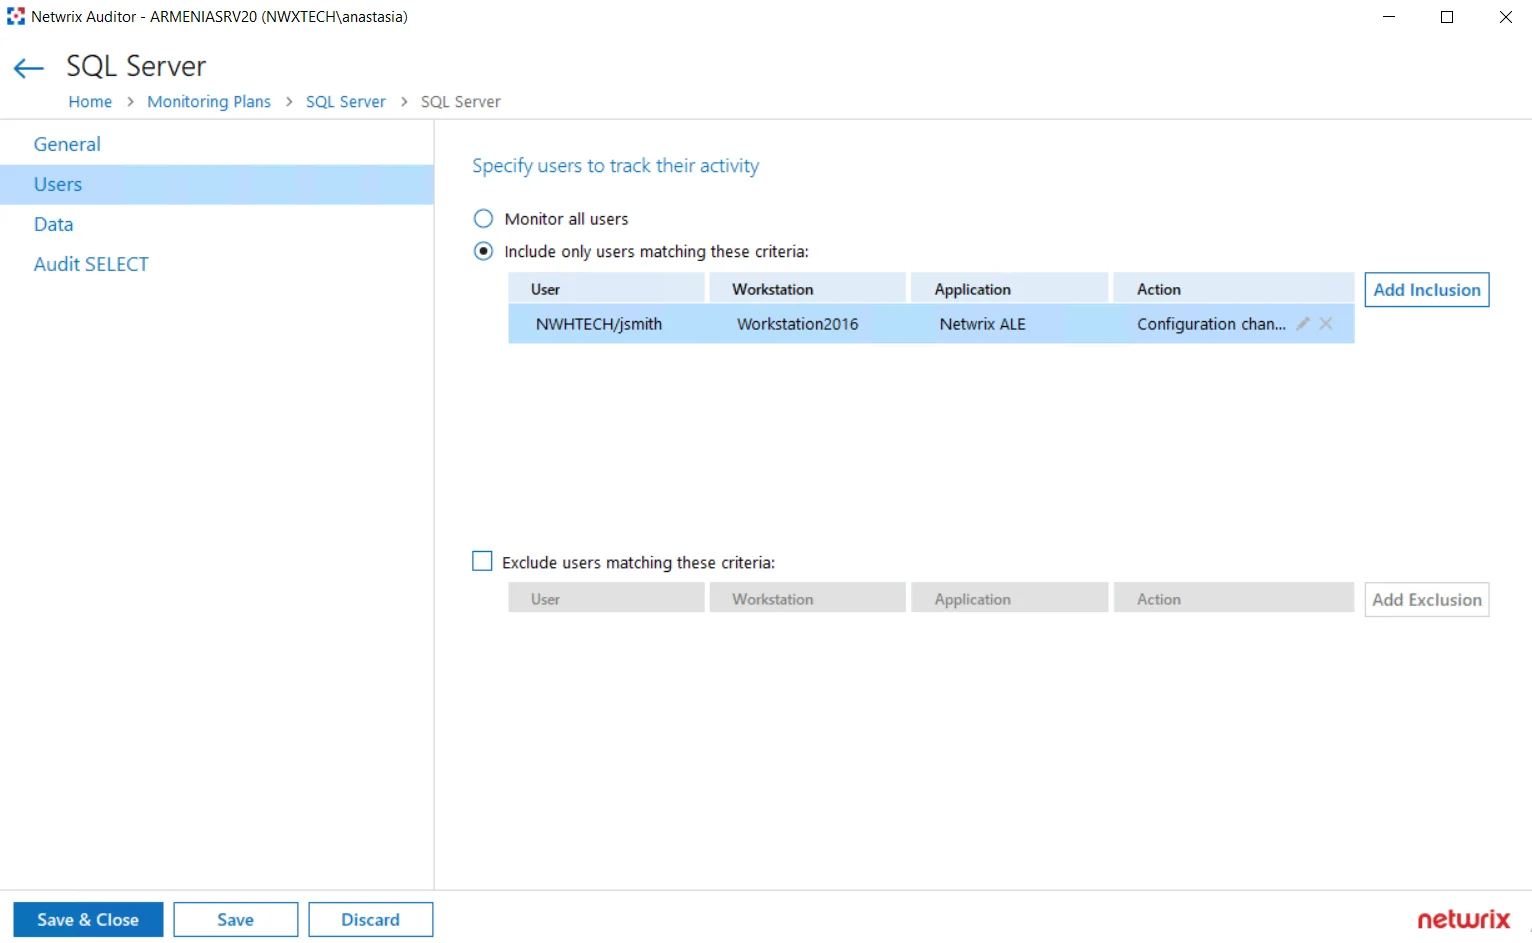
Users
On the Users tab, you can configure the following settings for SQL Server data source:
| Options | Description |
|---|---|
| Specify users to track their activity | Select the option you need to fine-tune your SQL Server monitoring scope. - Monitor all users - Include only users matching these criteria - Exclude users matching these criteria For example, you may need to track only actions performed by administrative accounts, or exclude the activity initiated by ordinary applications. If so, data should be filtered accordingly before it appears in search results, reports and Activity Summaries. You can create either inclusion or exclusion lists. All filters are applied using AND logic. To create a filter for user activity monitoring, select the related option and click the button on the right. Specify the following: - User — enter the initiator's account as it appears in the "Who" column of reports and Activity Summaries, for example: mydomain\user1. For events containing “System” in the “Who” column you can enter "System" . - Workstation where activity was initiated — enter the workstation name as it is shown in the "Workstation" column of reports and Activity Summaries, for example: StationWin2016. - Application that initiated the activity — enter the application name as shown next to "Application name" in details of reports and Activity Summaries. You can use a wildcard (*) to replace any number of characters in filters. In addition to the restrictions for a monitoring plan, you can use the *.txt files to collect more granular audit data. Note that the new monitoring scope restrictions apply together with previous exclusion settings configured in the *.txt files. See the Monitoring Planstopic for additional information. |
Data
On the Data tab, you can configure the following settings for SQL Server data source.
Remember, when auditing SQL Server availability on groups, the only supported data collection mode is the 'Do not use triggers' mode.
| Option | Description |
|---|---|
| --- | --- |
| --- | --- |
| Monitor changes to data in the database tables | Enable monitoring of changes to data stored in the database tables hosted on the SQL Server. If you plan to enable this option, make sure the account that runs the SQL Server service on the monitored instance has at least read permissions in the Active Directory domain (e.g., it does not run under a local user account). Otherwise, enabling this option may lead to issues when altering databases on the monitored SQL Server instances. |
| Data collection mode | |
| Do not use triggers | Default mode for a new installation of Netwrix Auditor. Data will be collected using the SQL Server traces. This mode allows you to get a sufficient level of detail in the reports and search results without producing additional load on your SQL Server instance. Thus, it is recommended for highly-transactional servers. When using this mode, consider that the "What" field of the Activity Record with "Object type" = "Data" may show incorrect data. The issues occur because the product applies data categories to an entire SQL Server table and not to rows. |
| Use triggers for detailed monitoring | However, if you require a very detailed reporting on the data changes, you can select this mode. It will be also selected by default if you are upgrading your Netwrix Auditor deployment. Data will be collected using a set of triggers. For more information on this technology, see https://kb.netwrix.com/728 . It is recommended to use this setting carefully, as collecting large amount of details from a highly-transactional server may affect its performance. Using this mode may lead to issues when altering databases on the monitored SQL Server instances. The issues occur only if the SQL Server service account does not have Read permissions in the Active Directory domain (e.g., a local user account). When using this mode, consider that the "What" field of the Activity Record with "Object type" = "Data" may show incorrect data. The issues occur because the product applies data categories to an entire SQL Server table and not to rows. Switching from the configured triggerless mode may lead to a data loss. The workaround is to force data collection right after enabling the triggers. |
| Changes (per transaction) to collect and report: | Specify how many changes per a database transaction you want to be collected. For example, you can limit this number to 10 changes per transaction, or collect all changes. It is recommended to adjust this setting carefully, as collecting large number of changes from a highly-transactional server may affect its performance. |
| Monitoring rules | To specify what data changes must be monitored, create at least one inclusion rule. Exclusion rules are optional. Click Add Rule and configure the following:  - Type — Select rule type: include or exclude. - Server — Specify a name of the monitored SQL Server instance where the required database resides. Use the server_name\instance_name format, for example, SQLsrv11\SQLExpress2016. NOTE: If you are going to configure monitoring rules for SQL Server Availability Groups, provide the name of your Availability Group item in this field. - Database — Specify the database whose data changes you want to monitor. - Table — Specify database table to monitor. - Column—Specify table column name. The following column types are currently not supported: - Type — Select rule type: include or exclude. - Server — Specify a name of the monitored SQL Server instance where the required database resides. Use the server_name\instance_name format, for example, SQLsrv11\SQLExpress2016. NOTE: If you are going to configure monitoring rules for SQL Server Availability Groups, provide the name of your Availability Group item in this field. - Database — Specify the database whose data changes you want to monitor. - Table — Specify database table to monitor. - Column—Specify table column name. The following column types are currently not supported: text, ntext, image, binary, varbinary, timestamp, sql_variant. These filters will be applied using AND logic. Wildcard (*) is supported and can be used to replace any number of characters. |
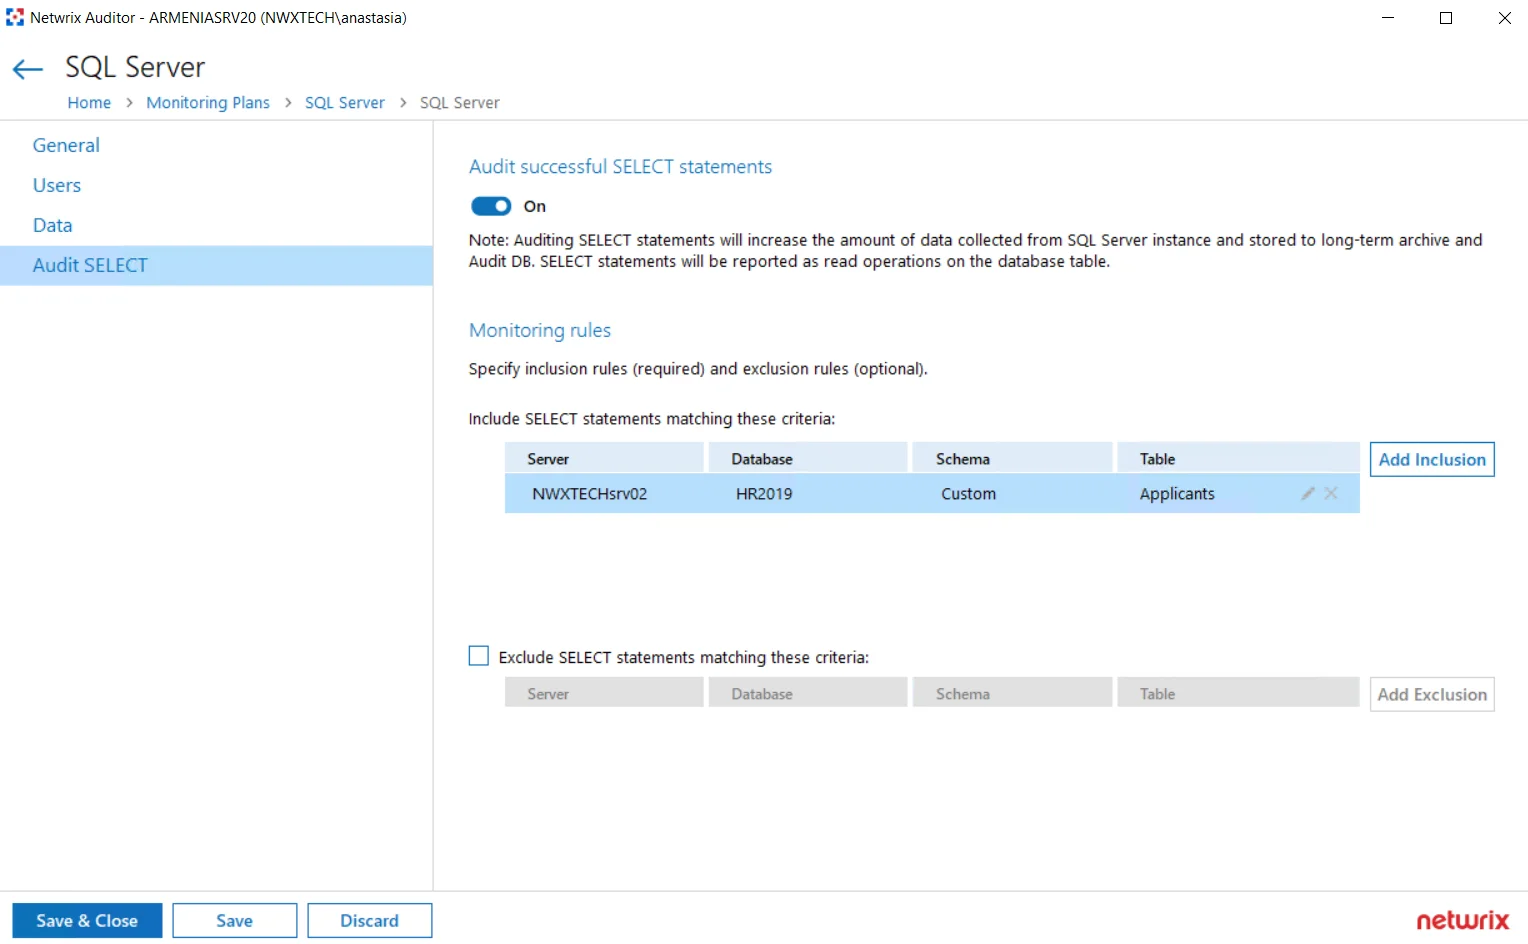
Audit SELECT
Use the settings in this section to configure how the successful SELECT statements should be audited.
| Option | Description |
|---|---|
| --- | --- |
| --- | --- |
| Audit successful SELECT statements | Enable monitoring of successful SELECT statements for the database tables. Successful SELECT statement execution will be reported as Read operation on the database table. Auditing SELECT statements will increase the amount of data collected from the SQL Server instance and stored to long-term archive and audit database. Plan for your resources accordingly. |
| Monitoring rules | To specify what data changes will be monitored, you must create at least one inclusion rule. Exclusion rules are optional. Click Add Inclusion and specify the following: 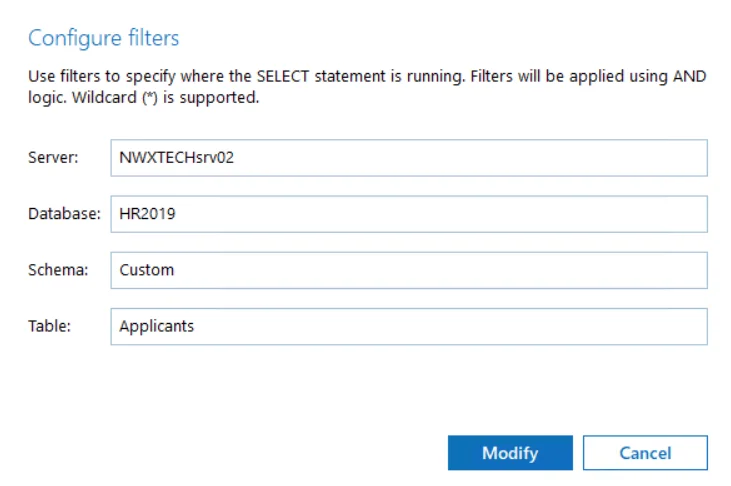 - Server — specify target SQL Server instance in the server\instance format. NOTE: If you are going to configure monitoring rules for SQL Server Availability Groups, provide the name of your Availability Group item in this field. - Database — specify target database - Schema — specify database schema - Table — specify database table you will monitor Wildcard (*) is supported and can be used to replace any number of characters. Filters will be applied using AND logic, that is, only SELECT statements matching all specified criteria will be monitored. So, in the example above, the program will track and report only the successful SELECT statements executed against the Applicants table of the HR2019 database with Custom schema, hosted on the SQLsrv02\TestInstance. When finished, click Add. If needed, configure the exclusion rules in a similar way. - Server — specify target SQL Server instance in the server\instance format. NOTE: If you are going to configure monitoring rules for SQL Server Availability Groups, provide the name of your Availability Group item in this field. - Database — specify target database - Schema — specify database schema - Table — specify database table you will monitor Wildcard (*) is supported and can be used to replace any number of characters. Filters will be applied using AND logic, that is, only SELECT statements matching all specified criteria will be monitored. So, in the example above, the program will track and report only the successful SELECT statements executed against the Applicants table of the HR2019 database with Custom schema, hosted on the SQLsrv02\TestInstance. When finished, click Add. If needed, configure the exclusion rules in a similar way. |