Netwrix Auditor Health Log
Daily summary of the Netwrix Auditor health log is displayed in the Health log widget. The chart shows how many events with different severity levels were written to the product health log in the last 24 hours. To open the health log, click the Open Health Log link in the Health Status dashboard. See the topic for additional information.
If you want to clear Netwrix Auditor Health Log, son the computer where Auditor Server is installed, navigate to EventViewer -> Application and Services Logs and locate the Netwrix Auditor System Health log. Then, follow the instructions provided by Microsoft. See the Microsoft article for additional information on How to Clear Event Logs.
Netwrix Auditor System Health Log
When an error occurs, a system administrator or support engineer must determine what caused this error and prevent it from recurring. For your convenience, Auditor records important events in the proprietary Netwrix Auditor System Health event log.
You can review events directly in the product:
-
When issues encountered during data collection, click Details... in the Status column and select View Health Log.
OR
-
In the main screen, in the Configuration section click the Health status tile, then in the Health log dashboard widget click Open health log.
You can also inspect the log in the Event Viewer.
There are three types of events that can be logged:
| Event Type | Description |
|---|---|
| Information | An event that describes the successful operation beginning or completion. For example, the product successfully completed data collection for a monitoring plan. |
| Warning | An event that is not necessarily significant, but may indicate a possible future problem. For example, the product failed to process a domain controller. |
| Error | An event that indicates a significant problem such as loss of data or loss of functionality. For example, the product failed to retrieve settings for your data source. |
Review the following:
If you want to monitor Auditor health status in more depth, you can do the following:
- Create a monitoring plan for this log using Event Log Manager too to collect activity data. See the Monitoring Overview topic for additional information.
- Configure alerts triggered by specific events in the product's health log. Create Alerts on Health Status
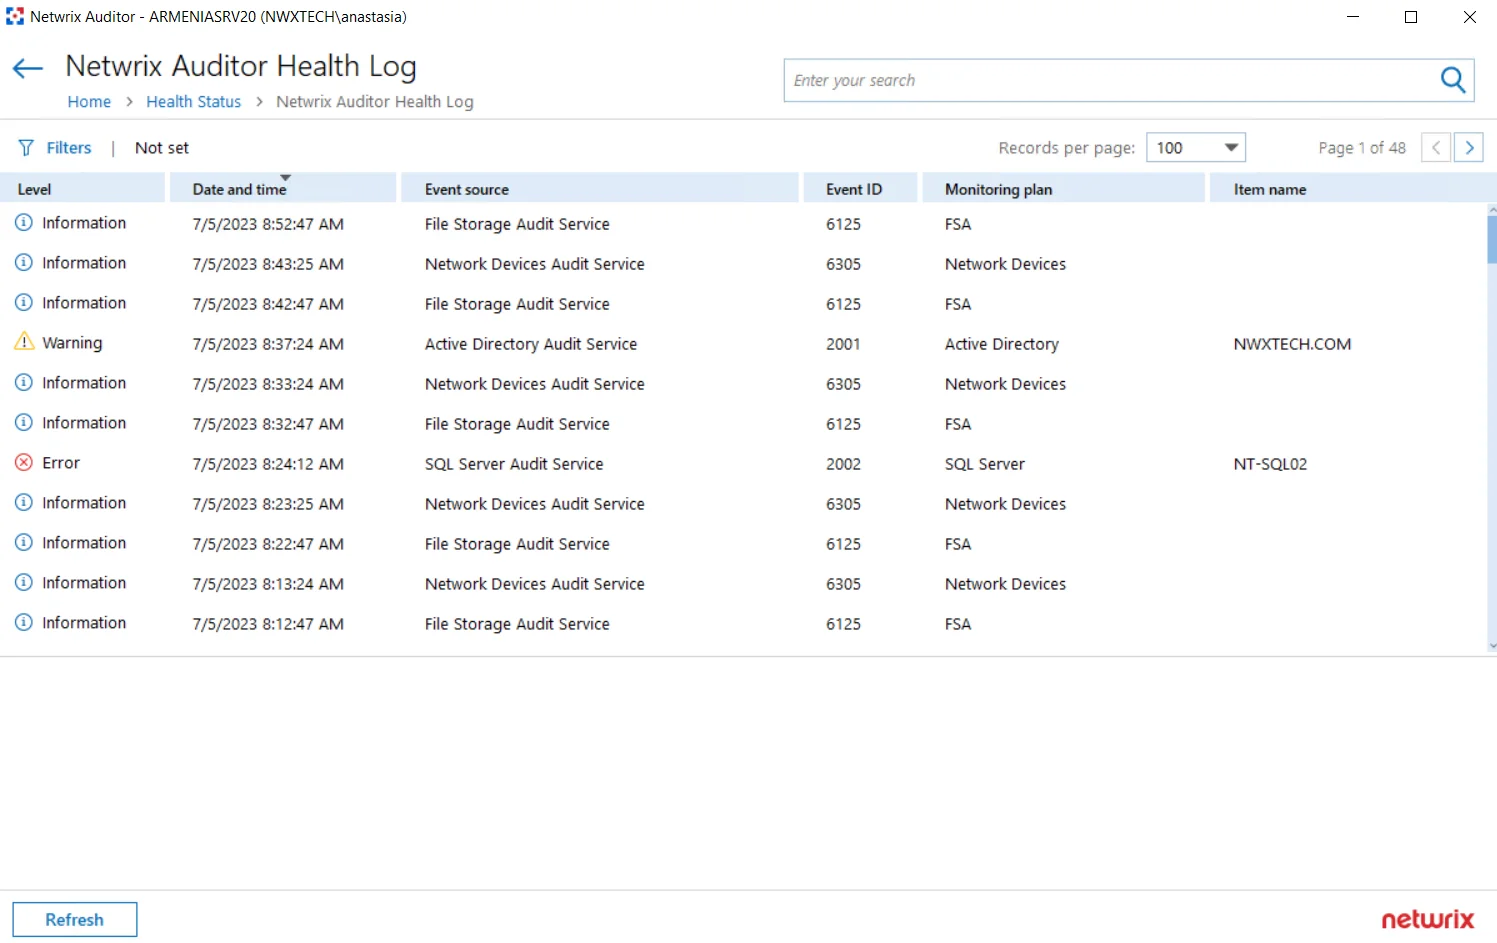
Inspect Events in Health Log
Follow the steps o inspect events in Netwrix Auditor health log
Step 1 – On the main Auditor page, select the Health status tile, then in the Health log dashboard widget click Open health log.
Step 2 – Select an entry to review it in details. You can also copy event details. Select the event in the list and click Copy details at the bottom of the window.
For your convenience, Auditor provides you with filters so that you can narrow down the number of events on the screen and focus on those that matter most. For example, warnings on failed data collection or events of an important monitoring plan.
Filter Events
Follow the steps to filter events.
Step 1 – Select Filters in the upper part of the Netwrix Auditor Health Log window.
Step 2 – Complete the following fields:
| Option | Description |
|---|---|
| Logged | Specify event logging time period (date range, yesterday, etc.). |
| Event level | Select level of the events that you want to be displayed. |
| Event source | Select services and applications whose events you want to view. |
| Monitoring plan | Select to display events from one or several monitoring plans. |
| Item name | Select to display events from the certain item(s) you need. |
| Event ID | Enter event ID number or range of event IDs separated by commas. For example, 1, 3, 5-99. You can also exclude unwanted event IDs from being displayed. Type the minus sign before selected event ID. For example, -76. |
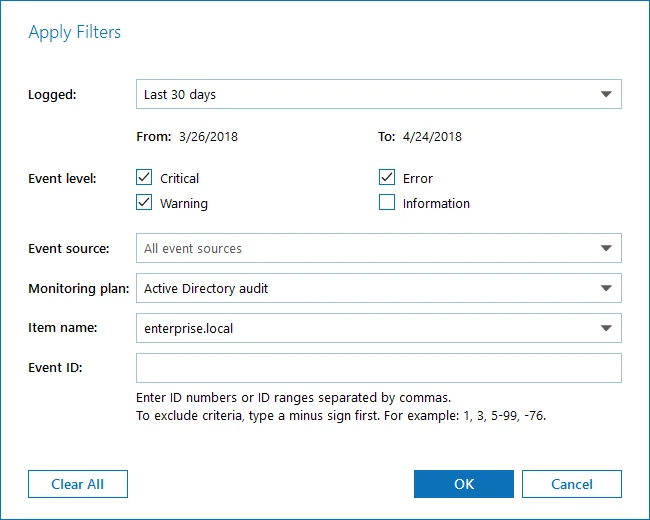
The applied filters will be listed on the top of the screen under the window title.