Ransomware Dashboard
View information on ransomware using the Ransomware Dashboard for Splunk.
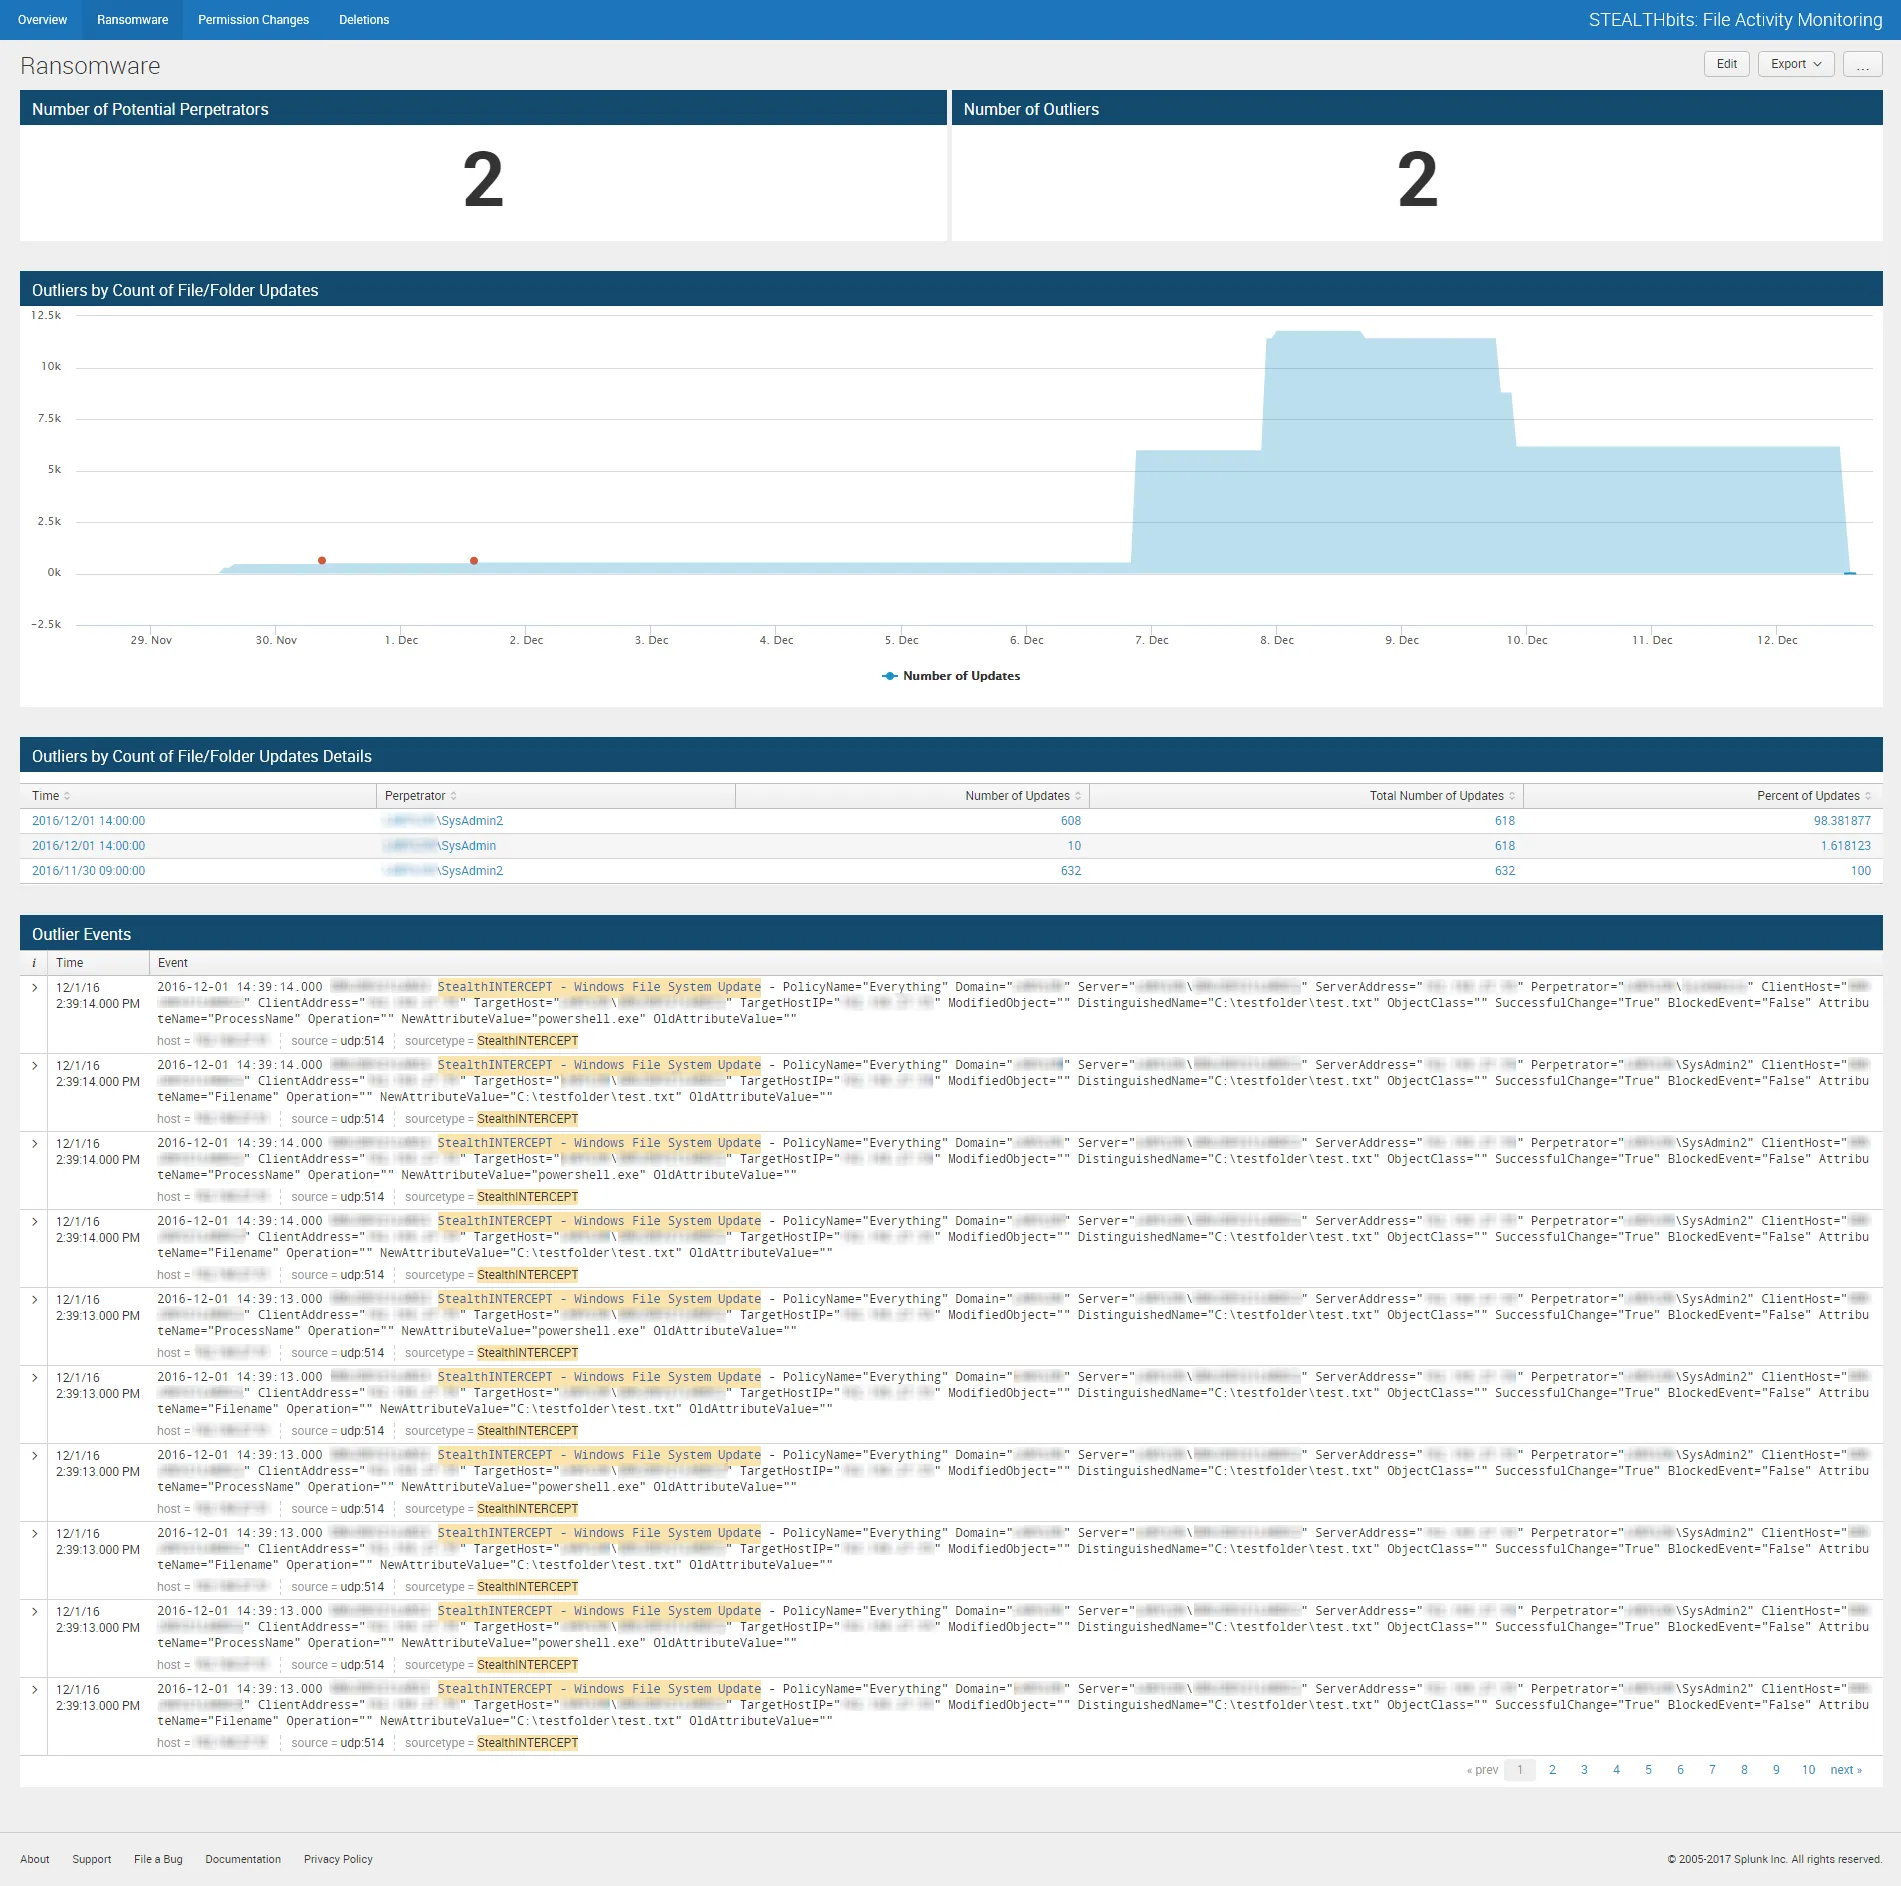
The Ransomware dashboard contains the following cards:
- Number of Potential Perpetrators – Number of users involved with events tied to outliers
- Number of Outliers – Number of outliers by count of file/folder update events
- Outliers by Count of File/Folder Updates – Graph of expected values for count of file/folder update events (blue area) and calculated outliers (red dots)
- Outliers by Count of File/Folder Updates Details – Breakdown of outliers by users involved in each outlier and percent of events by user
- Outlier Events – Tabular format of all file system change events related to outliers