Overview Dashobard
View general information on the Overview Dashboard for Splunk.
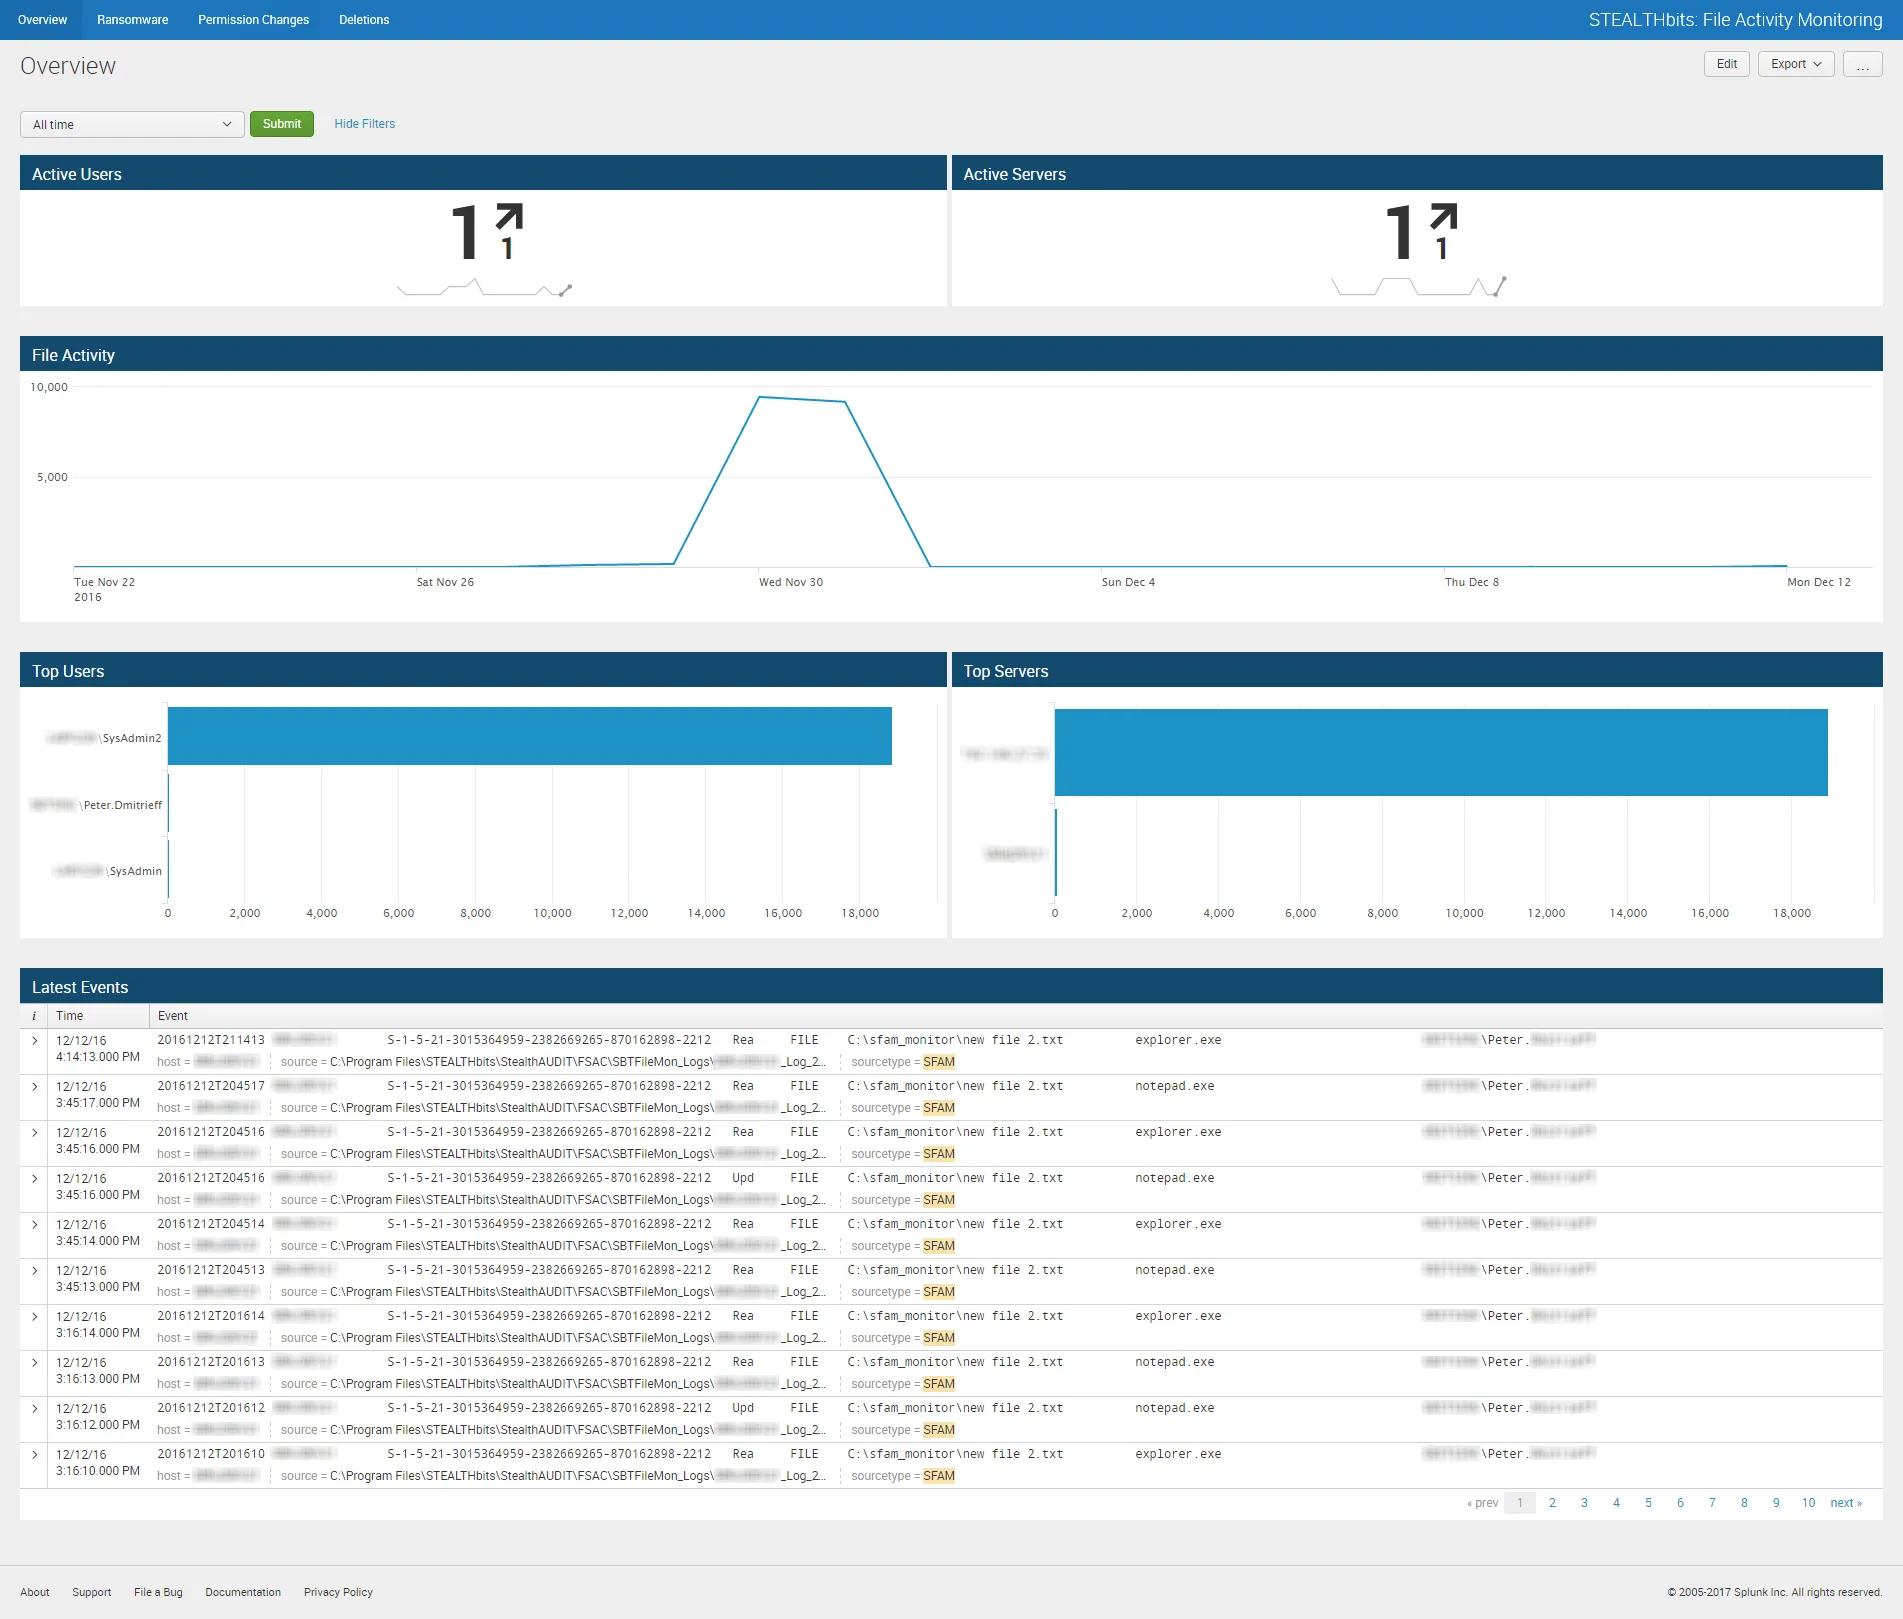
The File System Activity Overview dashboard contains the following cards:
- Active Users – Number of users involved with file system events in the specified timeframe
- Active Servers – Number of servers involved with file system events in the specified timeframe
- File Activity – Timeline of all file system events in the specified timeframe
- Top Users – Displays up-to the top five users addresses related to file system events which have been recorded in the specified timeframe
- Top Servers – Displays up-to the top five client IP addresses/host names related to file system events which have been recorded in the specified timeframe
- Latest Events – Tabular format of all file system change events which have been recorded in the specified timeframe
The specified timeframe is set by default to the Last 24 hours, or past day.