Overview Dashboard
View general information on the Overview Dashboard for Splunk.
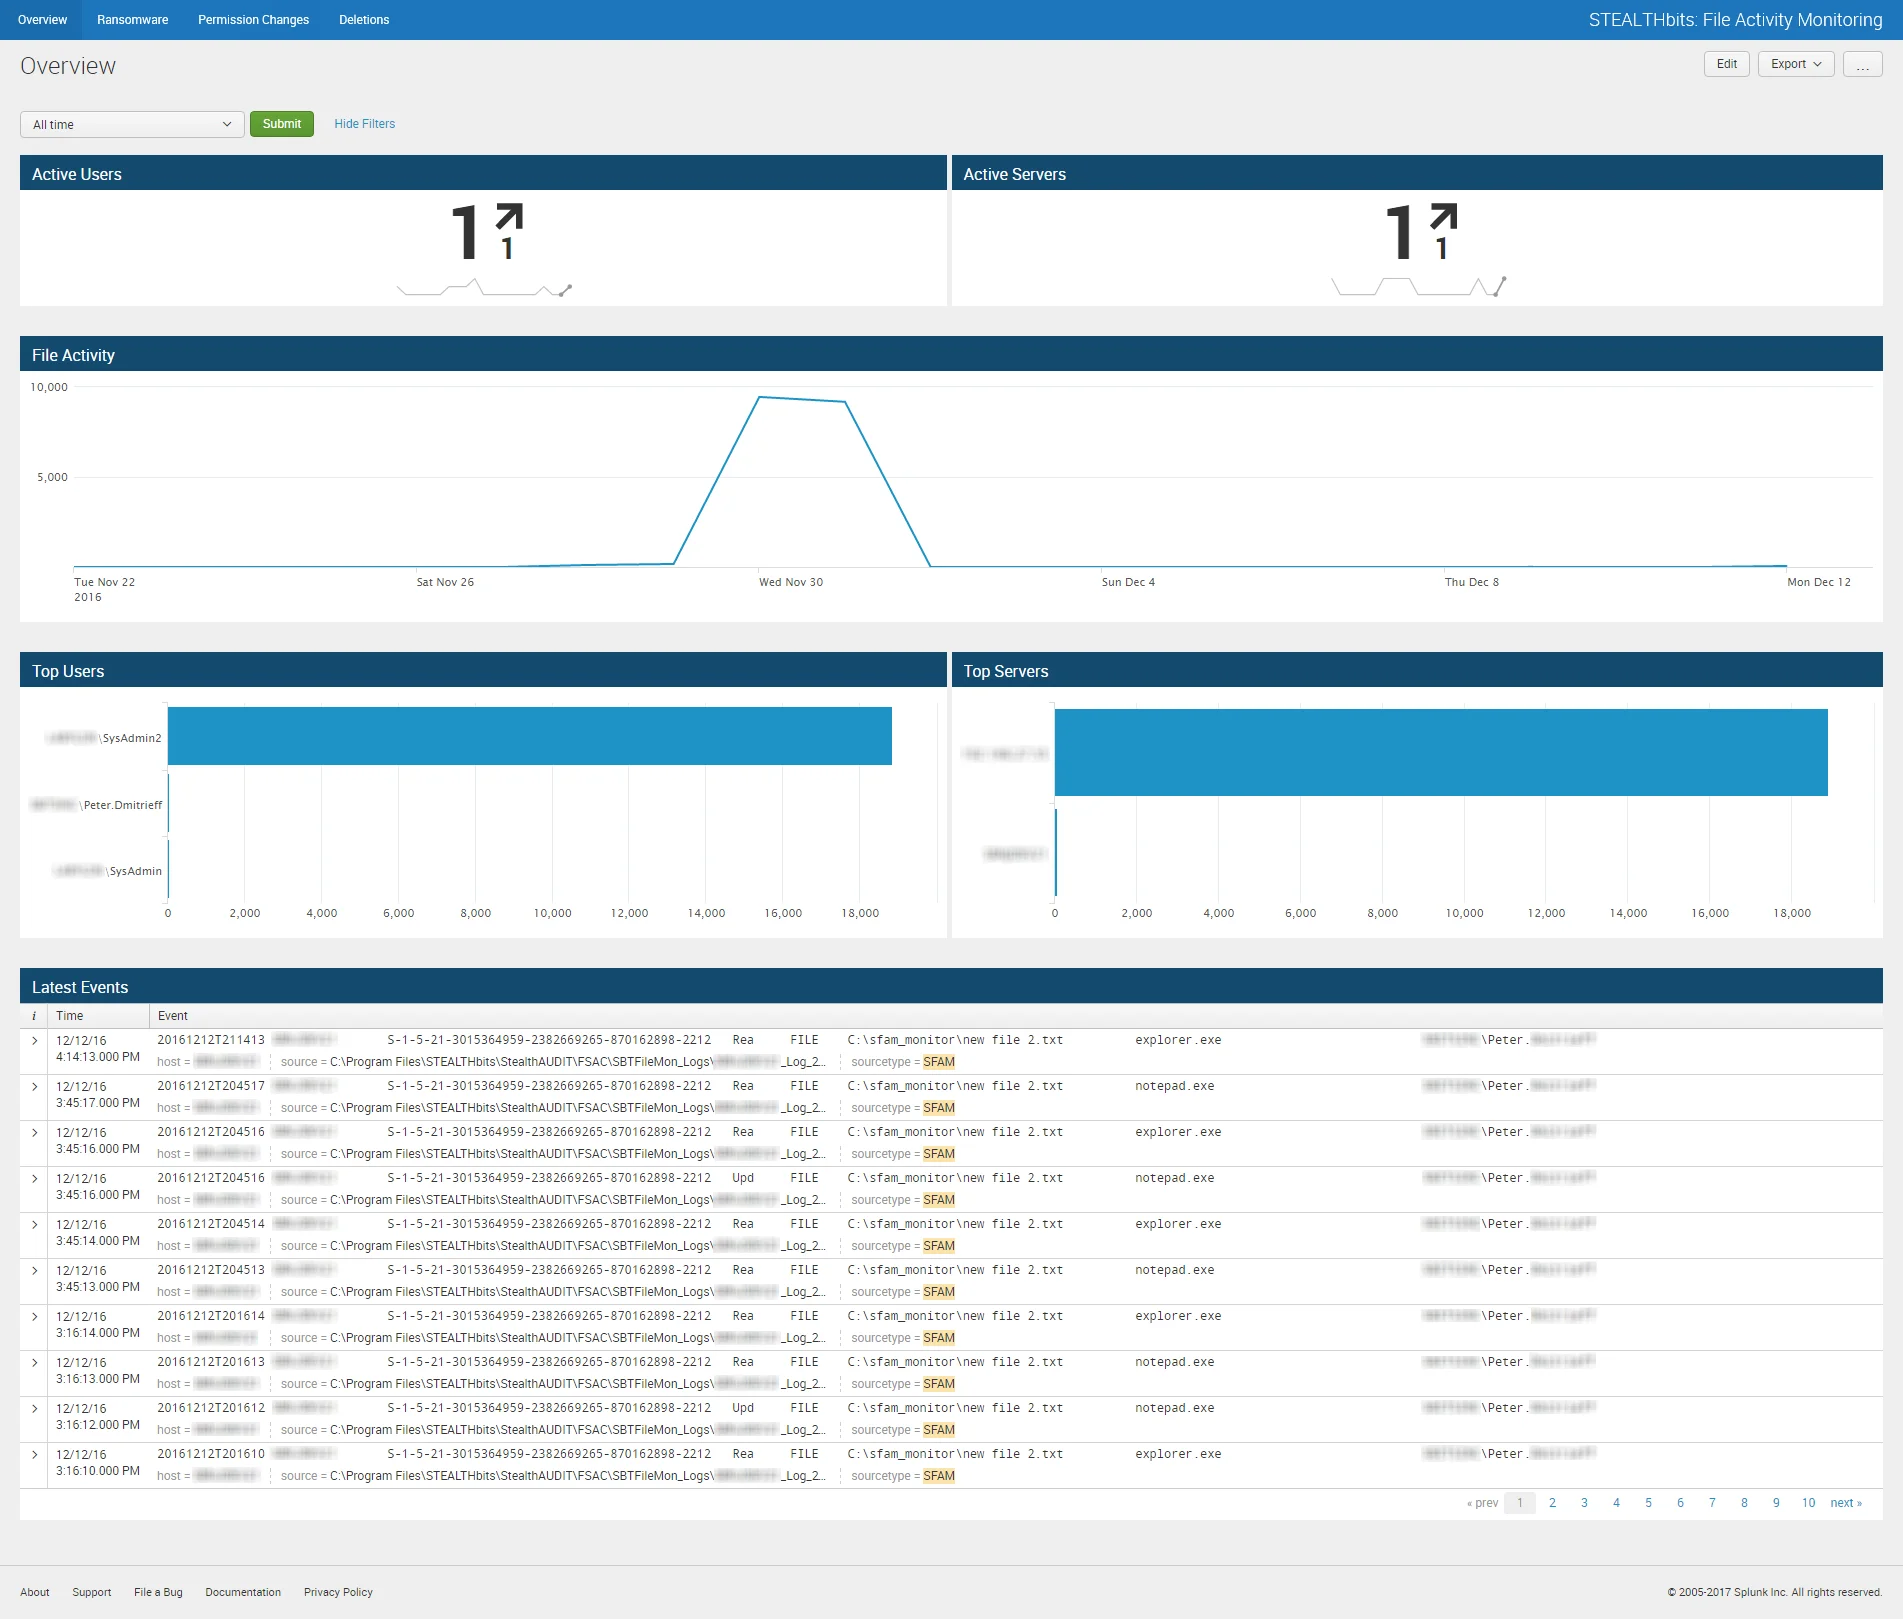
The File System Activity Overview dashboard contains the following cards:
- Active Users – Number of users involved with file system events in the specified timeframe
- Active Servers – Number of servers involved with file system events in the specified timeframe
- File Activity – Timeline of all file system events in the specified timeframe
- Top Users – Displays the top five users' addresses related to file system events in the specified timeframe
- Top Servers – Displays the top five client IP addresses and host names related to file system events in the specified timeframe
- Latest Events – Tabular format of all file system change events in the specified timeframe
The specified timeframe is set by default to the Last 24 hours, or past day.