NetApp
Understanding File Activity Monitoring
The Activity Monitor can be configured to monitor the following:
- Ability to collect all or specific file activity for specific values or specific combinations of values
It provides the ability to feed activity data to SIEM products. The following dashboards have been specifically created for Activity Monitor event data:
- For IBM® QRadar®, see the Netwrix File Activity Monitor App for QRadar for additional information.
- For Splunk®, see the File Activity Monitor App for Splunk for additional information.
It also provides the ability to feed activity data to other Netwrix products:
- Netwrix Enterprise Auditor
- Netwrix Threat Prevention
- Netwrix Threat Manager
Prior to adding a NetApp Data ONTAP host to the Activity Monitor, the prerequisites for the target environment must be met. See the NetApp Data ONTAP Cluster-Mode Activity Auditing Configuration topic or the NetApp Data ONTAP 7-Mode Activity Auditing Configuration topic in the for additional information.
Remember, the Activity Agent must be deployed to a Windows server that acts as a proxy for monitoring the target environment.
Add NetApp Host
Follow the steps to add a NetApp Data ONTAP host to be monitored.
Step 1 – In Activity Monitor, go to the Monitored Hosts tab and click Add. The Add New Host window opens.
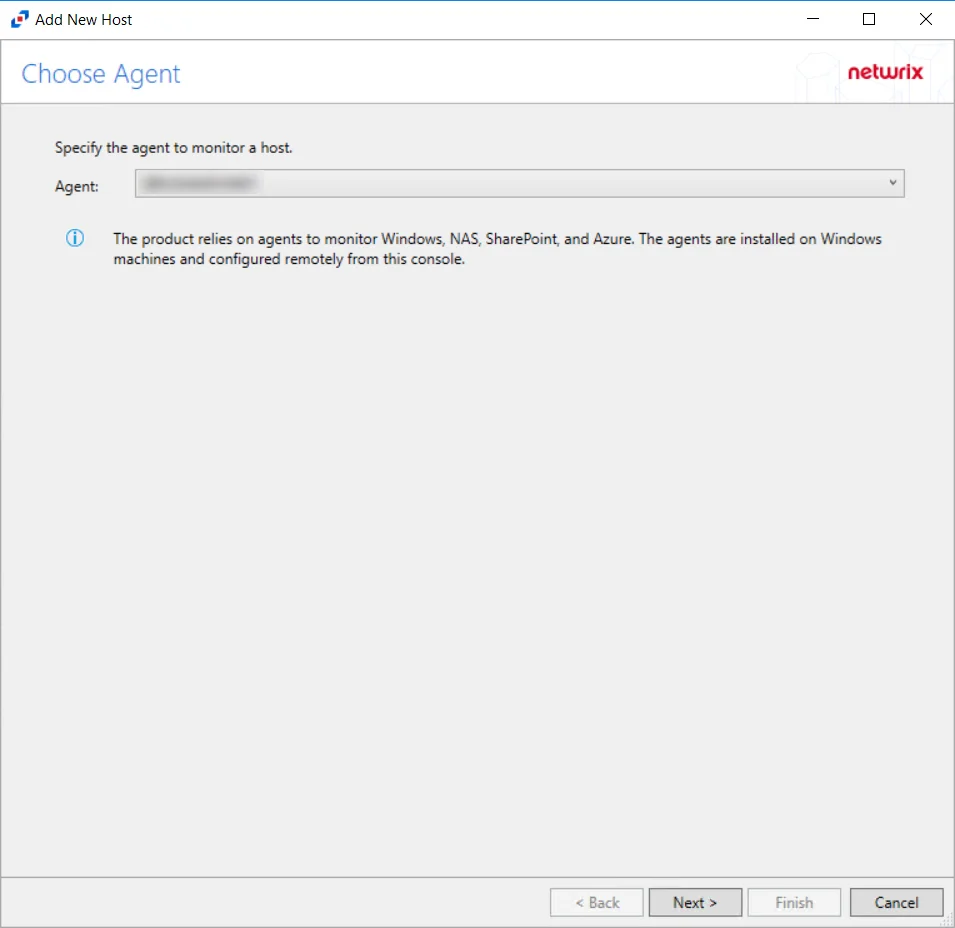
Step 2 – On the Choose Agent page, select the Agent to monitor the storage device. Click Next.
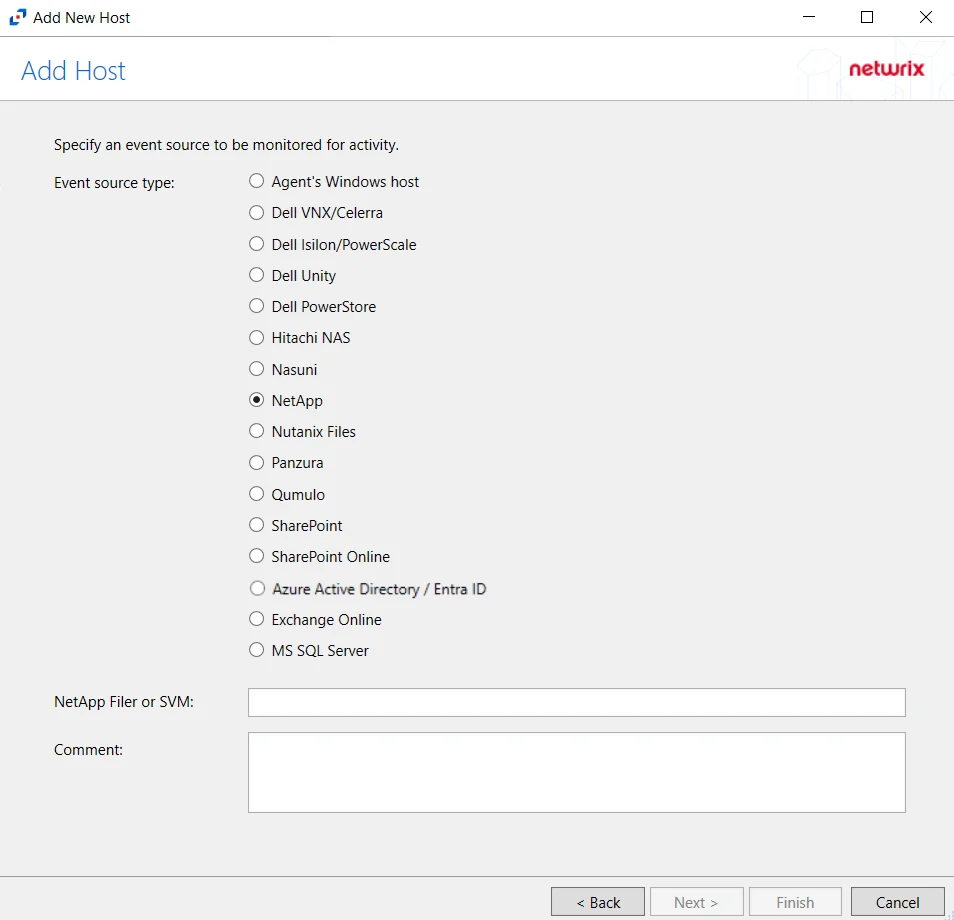
Step 3 – On the Add Host page, select the NetApp radio button. Then, in the NetApp Filer/SVM textbox, enter the following information:
- Cluster-Mode devices – Enter the NetApp Filer/SVM
- 7-Mode devices – Enter the NetApp DNS name. If using vFilers, then it is necessary to use the vFiler name here.
Click Next.
Cluster-Mode is case sensitive. The case of the Filer or SVM name must match exactly to how it is in NetApp's FPolicy configuration.
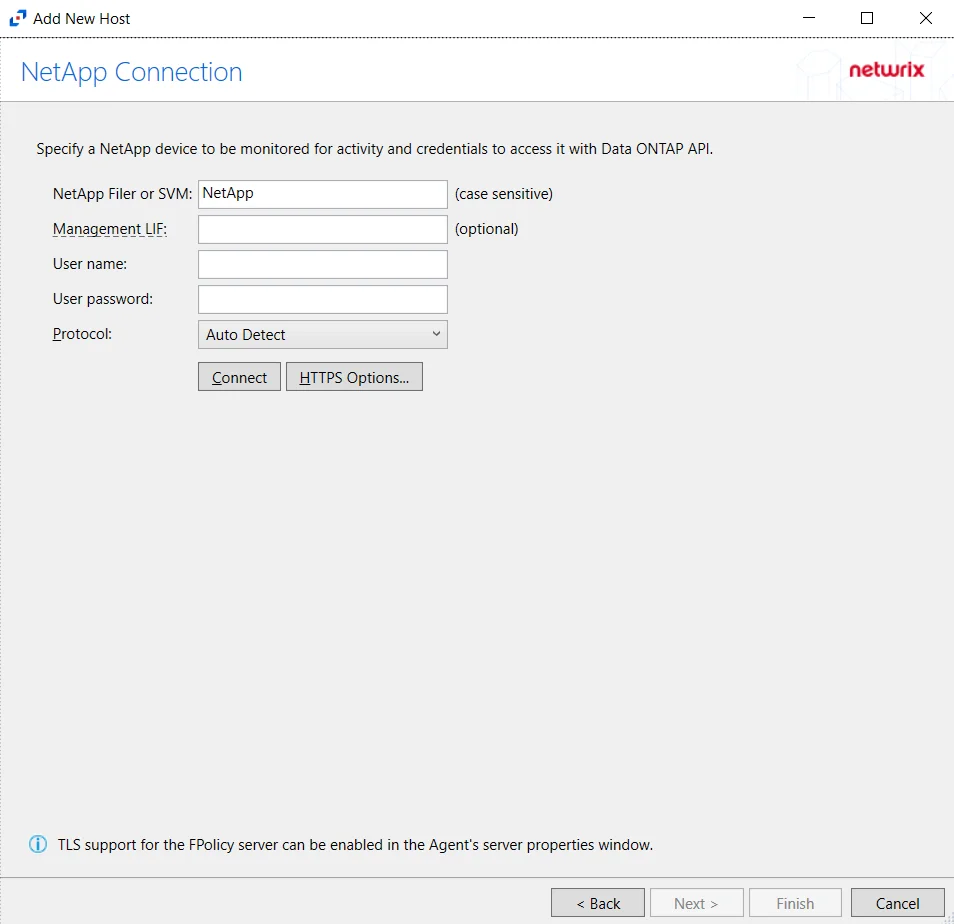
Step 4 – On the NetApp Connection page, enter the following:
- NetApp Filer or SVM – Enter the name of the NetApp Filer or SVM. The name is case sensitive.
- Management LIF – (Optional) If using Cluster Management LIF, a Management LIF can be specified if SVM Management LIF is not used (Vserver Tunneling)
- User name – Enter the user name for the credentials to connect to the NetApp server
- User password – Enter the password for the credentials to connect to the NetApp server
- Protocol – Select from the following options in the drop-down list:
- Auto Detect
- HTTPS
- HTTPS, ignore certificate errors
- HTTP
- Connect – Click to connect using the selected protocol and validate the connection with NetApp
Click Next.
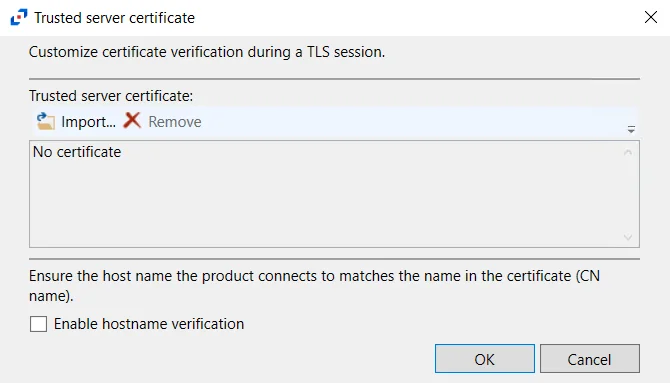
- HTTPS Options – Opens the Trusted server certificate window to customize the certificate
verification during a TLS session
- Import – Click to browse for a trusted server certificate
- Remove – Click to remove selected trusted server certificate
- Enable hostname verification – Select this checkbox to ensure that the host name the product connects to matches the name in the certificate (CN name)
- Click OK to close the window and save the modifications.
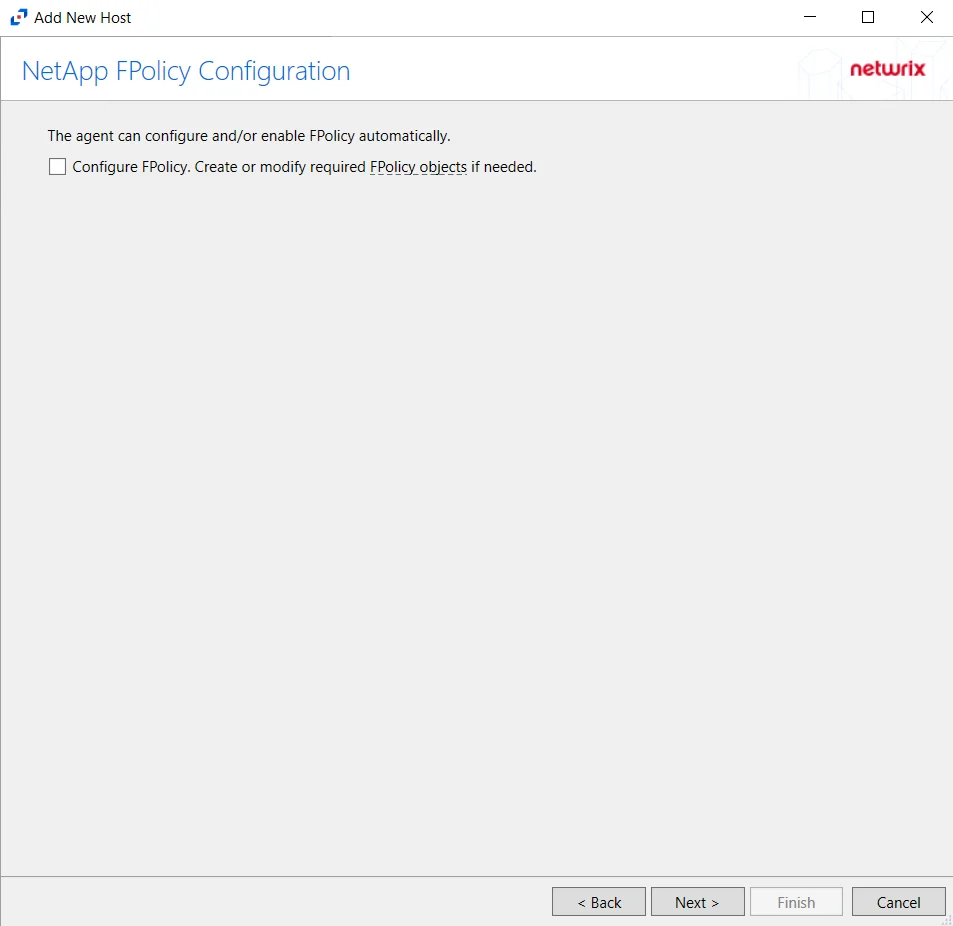
Step 5 – On the NetApp Mode FPolicy Configuration page, choose whether or not to automatically configure FPolicy through Activity Monitor. If that is desired, check the Configure FPolicy option. Any additional permissions required are listed. Be sure to select the appropriate file protocol to configure the FPolicy.
NetApp FPolicy Enable and Connect requires the provisioned user account to have full permissions. For Cluster-mode devices, the credentials are identified as ‘Employing the “Configure FPolicy” Option’.
Additional permissions that are required if enabling Configure FPolicy are:
- Command
vserver fpolicy- Access level:All - Command
security certificate install- Access levelAll(Need for FPolicy TLS only)
Click Next.
Important Notes
For NetApp Cluster-Mode, create a tailored FPolicy manually. If manually configuring the FPolicy, do not select the ConfigureFPolicy checkbox.
If automatic configuration is selected, proceed to the Configure Privileged Access section after successfully adding the host.
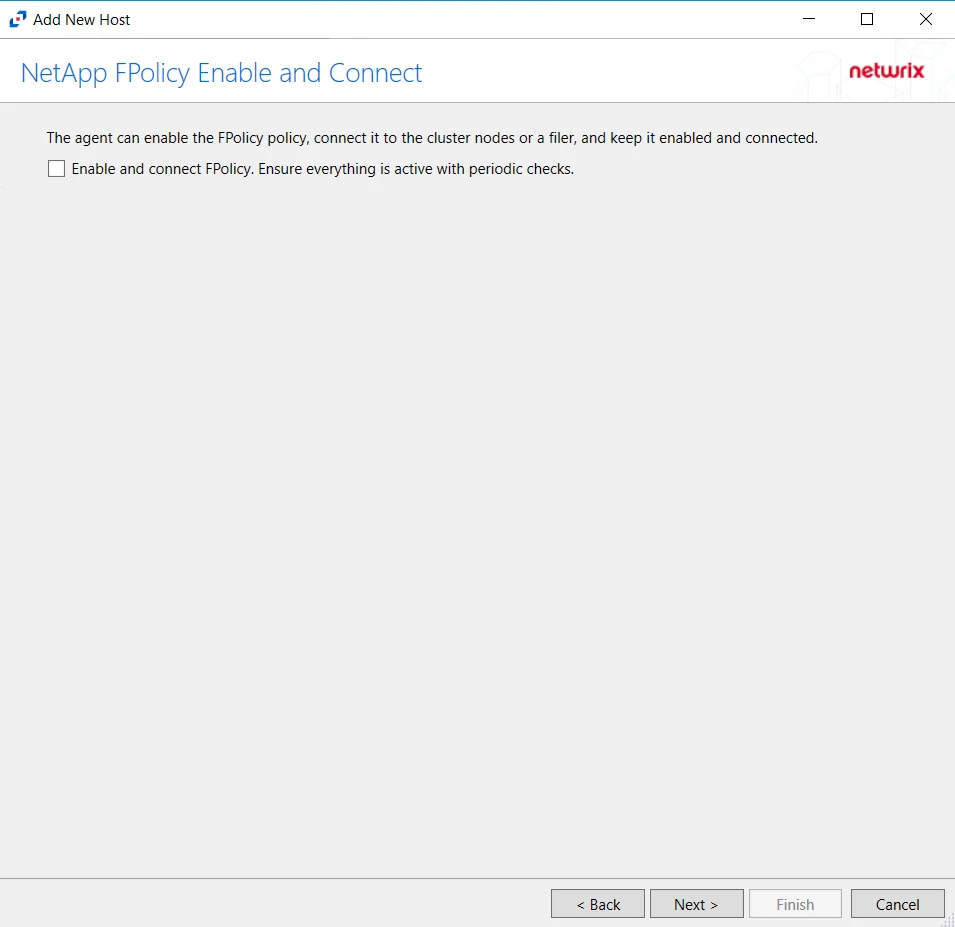
The options on the Configure Operations page require the provisioned user account to have, at a minimum, the less privileged permissions. For Cluster-mode devices, the credentials are identified as ‘Employing the “Enable and connect FPolicy” Option’.
On the NetApp FPolicy Enable and Connect page, choose whether or not to Enable and connect FPolicy, which will “Ensure everything is active with periodic checks.”
Additional permissions that are required if enabling Enable and connect FPolicy are:
- Command
vserver fpolicy disable- Access levelAll - Command
vserver fpolicy enable- Access levelAll - Command
vserver fpolicy engine-connect- Access levelAll - Command
network interface- Access levelreadonly
Important Notes
Enable this functionality. Without this option enabled, it is necessary to manually connect the FPolicy every time it is disconnected for any reason. For reliable, high availability file monitoring, use this option.
Click Next.
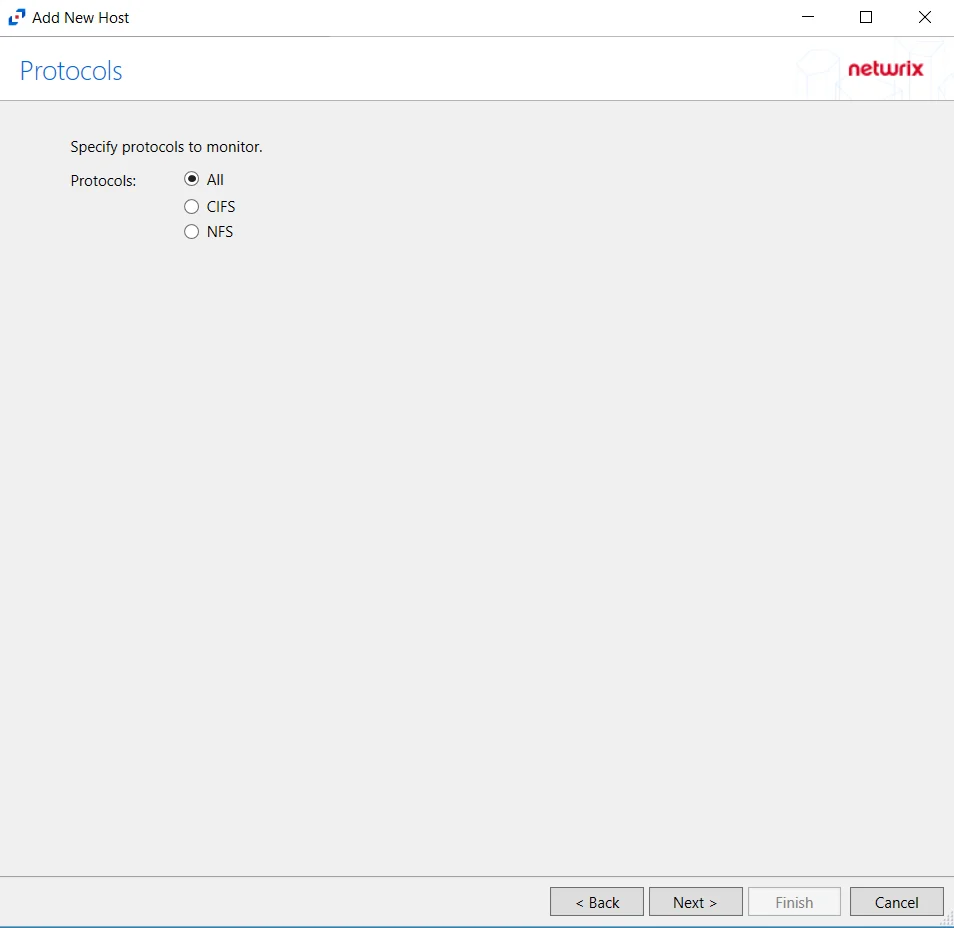
Step 6 – On the Protocols page, select which protocols to monitor. The protocols that can be monitored are:
- All
- CIFS
- NFS
Click Next.
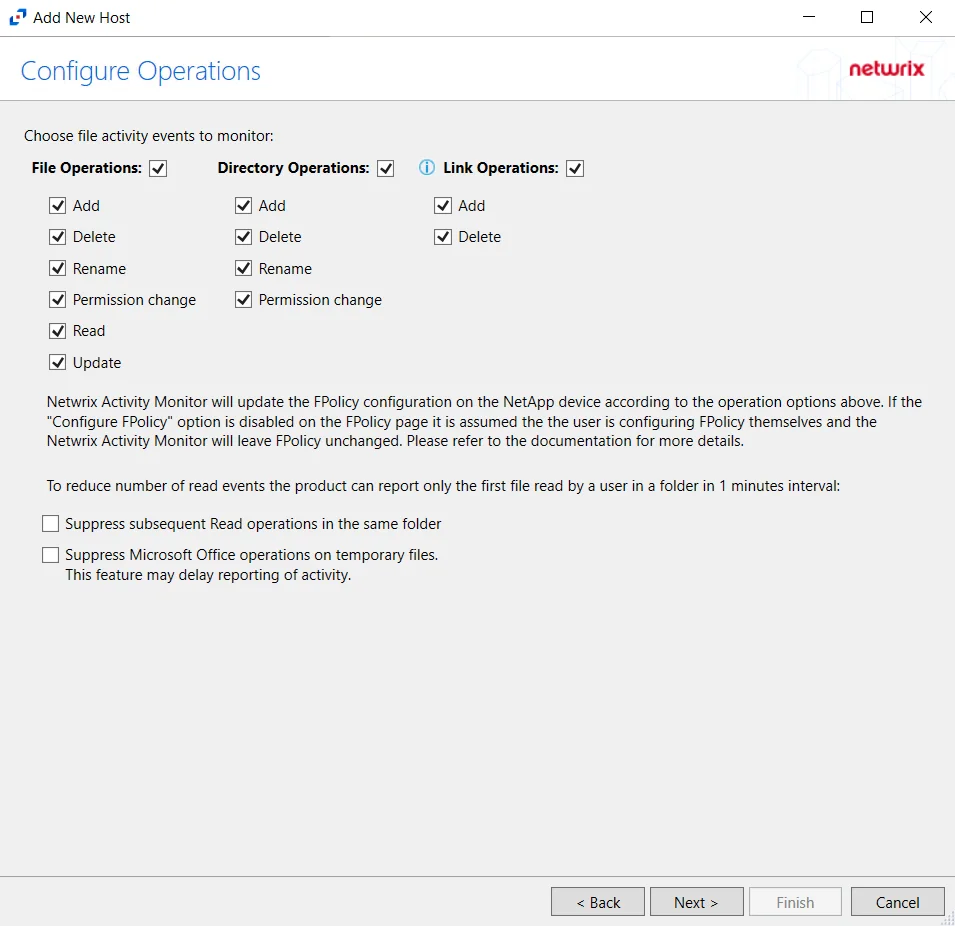
Step 7 – On the Configure Operations page, select the File Operations and Directory Operations to be monitored.
NetApp Data ONTAP Cluster-Mode Device folders are now readable by checking the Read / List option listed under Directory Operations. This option is also accessible within the NetApp server’s properties > Operations tab.
If the Configure FPolicy option is enabled, then Activity Monitor updates the FPolicy according to these settings. If it was not enabled, then the manually configured FPolicy must be set to monitor these operations. Only operations being monitored by the FPolicy are available to the activity agent.
Additional options include:
Enabling the Suppress subsequent Read operations in the same folder option can result in Read events not being monitored.
- Suppress subsequent Read operations in the same folder – Logs only one Read operation when subsequent Read operations occur in the same folder. This option is provided to improve overall performance and reduce output log volume.
- Suppress Microsoft Office operations on temporary files – Filters out events for Microsoft Office temporary files. When Microsoft Office files are saved or edited, many temporary files are created. With this option enabled, events for these temporary files are ignored.
Click Next.
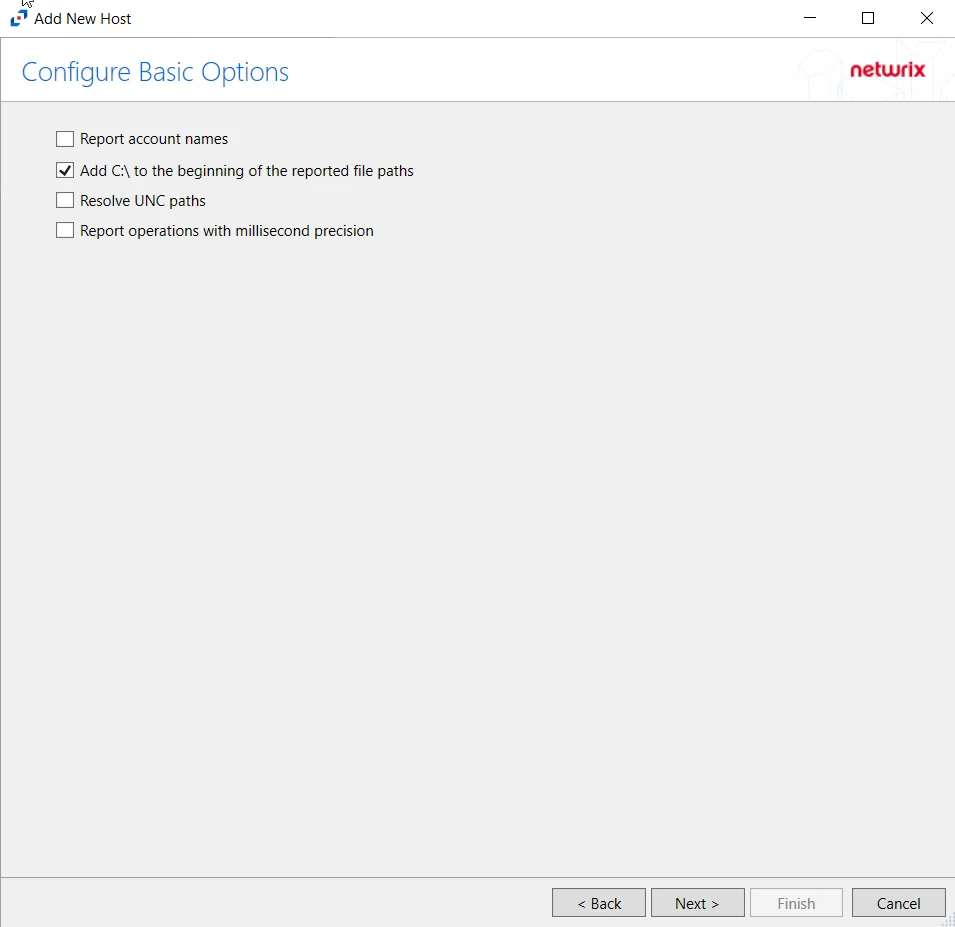
Step 8 – On the Configure Basic Options page, choose which settings to enable. The “Log files” are the activity logs created by the activity agent on the proxy host. Select the desired options:
- Report account names – Adds an Account Name column in the generated TSV files
- Add C:\ to the beginning of the reported file paths – Adds ‘C:\” to file paths to be displayed
like a Windows file path:
- Display example if checked – C:\Folder\file.txt
- Display example if unchecked – /Folder/file.text
- Report UNC paths – Adds a UNC Path column and a Rename UNC Path column in the generated TSV files
- This option corresponds to the REPORT_UNC_PATH parameter in the INI file. It is disabled by
default. The UNC Path is in the following format:
- For CIFS activity –
\\[HOST]\[SHARE]\[PATH] - Example CIFS activity –
\\ExampleHost\TestShare\DocTeam\Temp.txt - For NFS activity –
[HOST]:/[VOLUME]/[PATH] - Example NFS activity –
ExampleHost:/ExampleVolume/DocTeam/Temp.txt
- For CIFS activity –
- When the option is enabled, the added columns are populated when a file is accessed remotely through the UNC Path. If a file is accessed locally, these columns are empty. These columns have also been added as Syslog macros.
- This option corresponds to the REPORT_UNC_PATH parameter in the INI file. It is disabled by
default. The UNC Path is in the following format:
- Report operations with millisecond precision – Changes the timestamps of events being recorded in
the TSV log file for better ordering of events if multiple events occur within the same second
- Enterprise Auditor 8.1+ is required for this feature
Click Next.
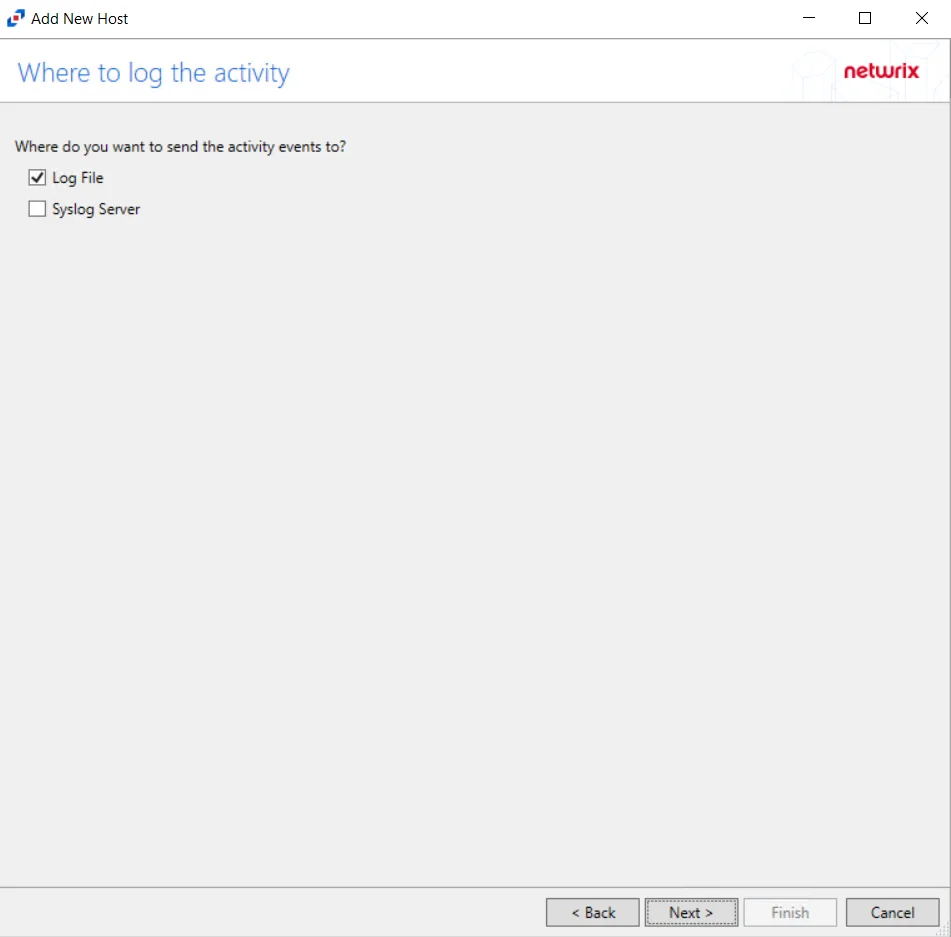
Step 9 – On the Where To Log The Activity page, select whether to send the activity to either a Log File or Syslog Server. Click Next.
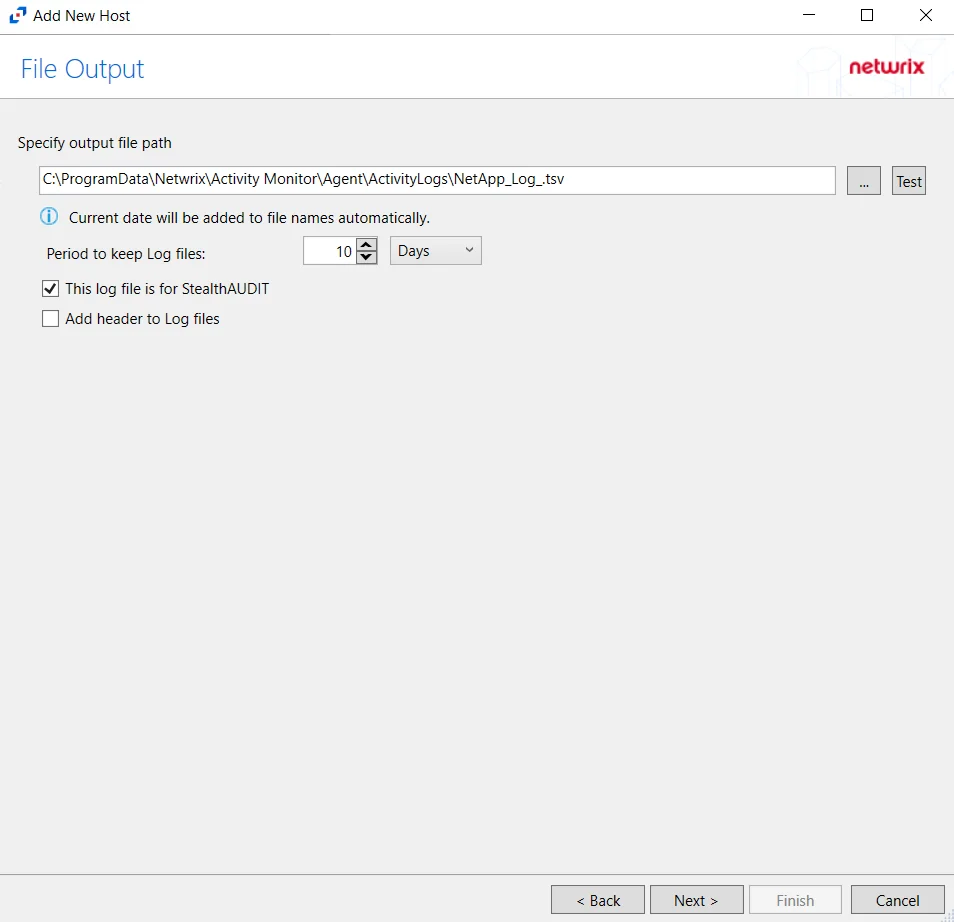
Step 10 – If Log File) is selected on the Where To Log The Activity page, the File Output page can be configured.
-
Specify output file path – Specify the file path where log files are saved. Click the ellipses button (...) to open the Windows Explorer to navigate to a folder destination. Click Test to test if the path works.
-
Period to keep Log files – Log files will be deleted after the period entered number of days entered. The default is 10 days. Use the dropdown to specify whether to keep the Log files for a set amount of Minutes, Hours, or Days.
-
This log file is for Enterprise Auditor – Enable this option to have Netwrix Enterprise Auditor collect this monitored host configuration
infoIdentify the configuration to be read by Netwrix Enterprise Auditor when integration is available.
- While Activity Monitor can have multiple configurations per host, Netwrix Enterprise Auditor can only read one of them.
-
Add header to Log files – Adds headers to TSV files. This is used to feed data into Splunk.
Click Next.
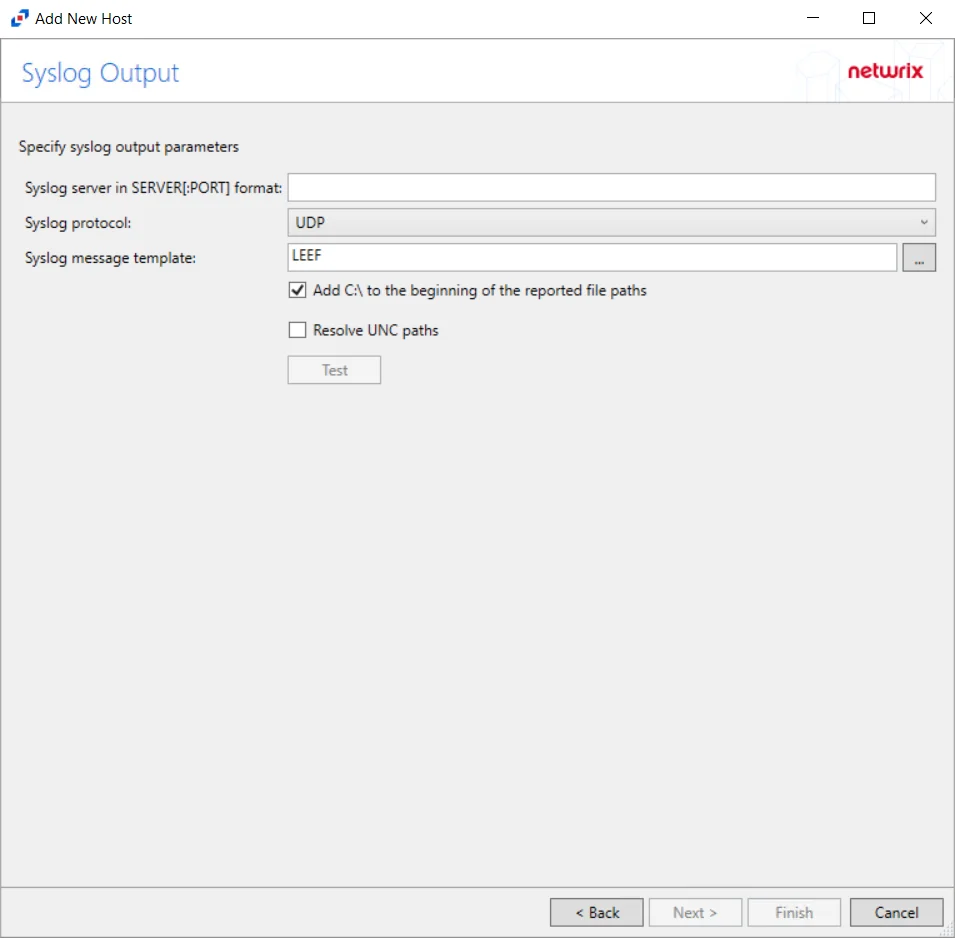
Step 11 – If Syslog Server is selected on the Where To Log The Activity page, the Syslog Output page can be configured.
-
Syslog server in SERVER[:PORT] format – Type the Syslog server name with a SERVER:Port format in the textbox.
- The server name can be short name, fully qualified name (FQDN), or IP Address, as long as the organization’s environment can resolve the name format used. The Event stream is the activity being monitored according to this configuration for the monitored host.
-
Syslog Protocol – Identify the Syslog protocol to be used for the Event stream. The drop-down menu includes:
- UDP
- TCP
- TLS
The TCP and TLS protocols add the Message framing drop-down menu. See the Syslog Tab topic for additional information.
-
The Test button sends a test message to the Syslog server to check the connection. A green check mark or red will determine whether the test message has been sent or failed to send. Messages vary by Syslog protocol:
- UDP – Sends a test message and does not verify connection
- TCP/TLS – Sends test message and verifies connection
- TLS – Shows error if TLS handshake fails
See the Syslog Tab topic for additional information.
Click Finish.
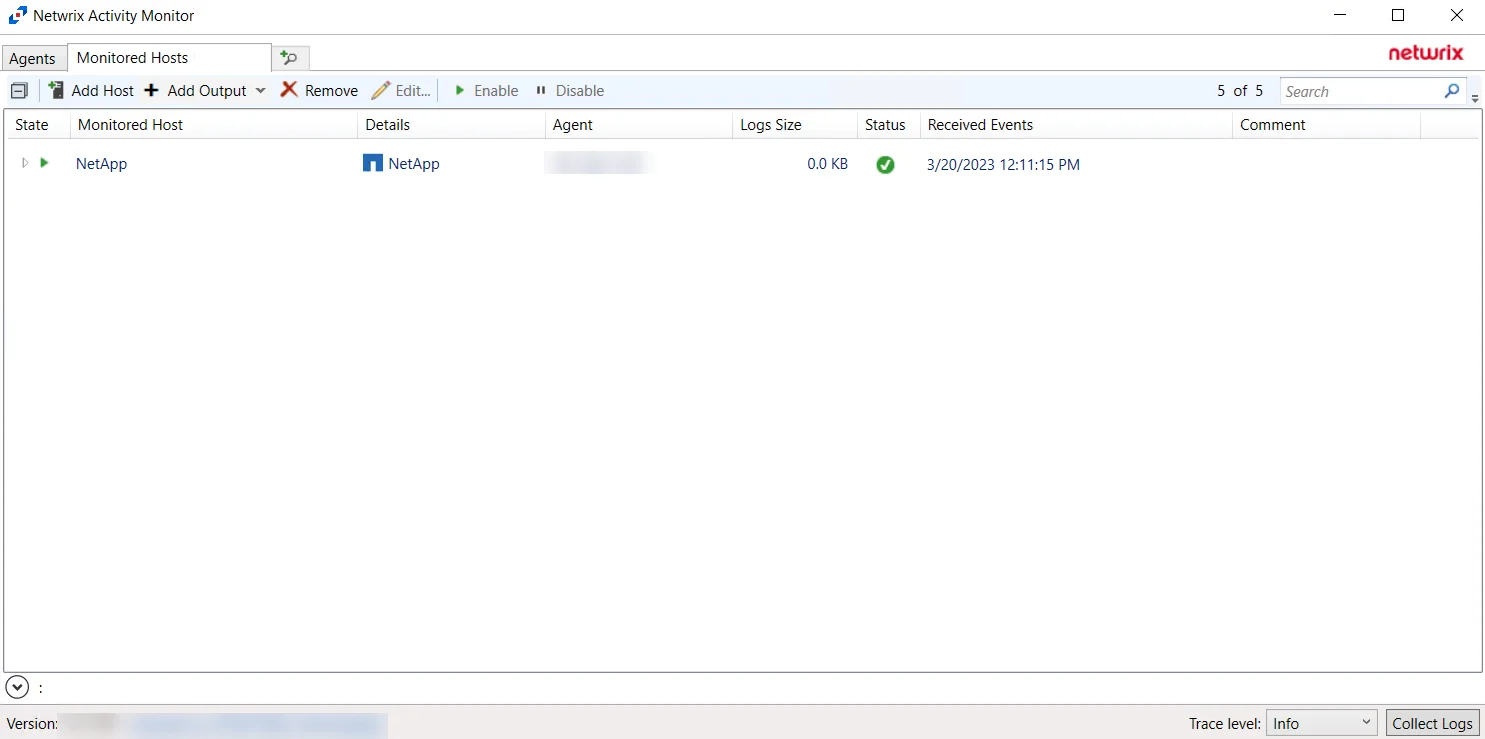
The added NetApp host is displayed in the monitored hosts table. Once a host has been added for monitoring, configure the desired ouptuts. See the Output for Monitored Hosts topic for additional information.
Remember, if automatic configuration of the FPolicy was selected, it is necessary to Configure Privileged Access.
Configure Privileged Access
If automatic configuration of the FPolicy is used for NetApp Data ONTAP Cluster-Mode devices, it is necessary to configure privileged access. Follow the steps to configure privileged access. Remember, this requires the provisioned user account to have full permissions, identified as the credentials ‘Employing the “Configure FPolicy” Option’.
Step 1 – On to the Monitored Hosts tab, select the desired host and click Edit. The host’s Properties window opens.
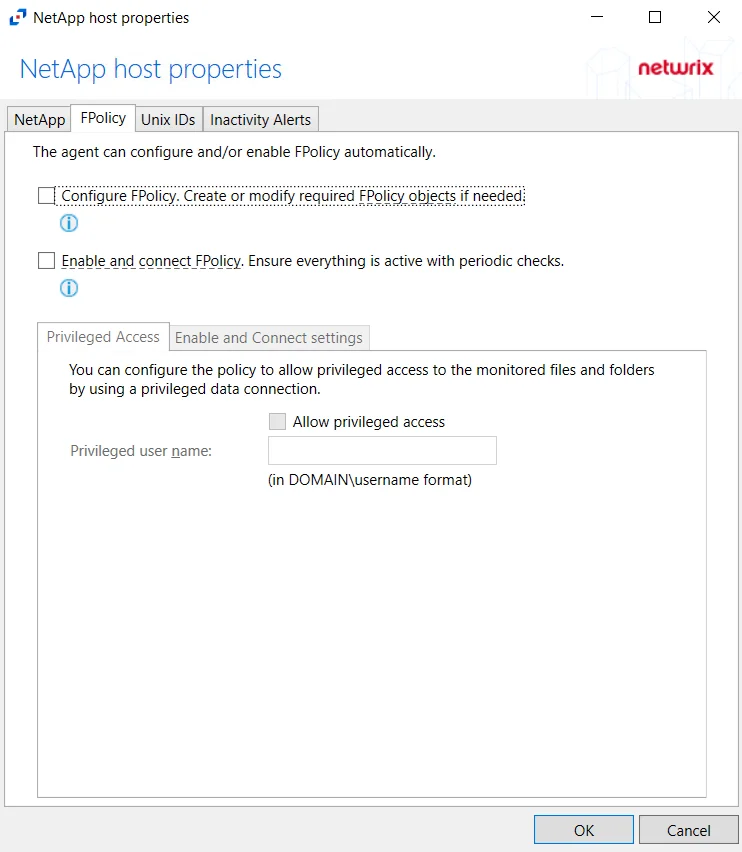
Step 2 – On the FPolicy tab, select the Privileged Access tab. Select the Allow privileged access checkbox and provide the Privileged user name in the textbox.
This option is only available if the Configure FPolicy option is enabled.
Privileged access must be allowed and configured with appropriate credentials to leverage Enterprise Auditor permission (FSAA) scans for this NetApp device
For information on the other options for this tab, see the FPolicy Tab section.
Host Properties for NetApp
Configuration settings can be edited through the tabs in the host’s Properties window. The configurable host properties are:
See the Host Properties Window topic for additional information.