Monitored Domains Tab
Understanding Active Directory Activity Monitoring
The Activity Monitor can be configured to monitor the following Active Directory changes:
- Success and Failure on Object Create
- Success and Failure on Object Delete
- Success and Failure on Object Rename
- Success and Failure on Object Move
- Success and Failure on Logon
- LDAP Activity Monitoring
It also provides the ability to feed activity data to other Netwrix products:
- Netwrix Enterprise Auditor
- Netwrix Threat Manager
It also provides the ability to feed activity data to SIEM products.
Agents
For monitoring an Active Directory domain, the AD Agent must be installed on all domain controllers within the domain to be monitored.
Tab
Once the AD Agent(s) installation is complete on a domain controller, the domain appear on the Monitored Domains tab. The tab is not visible within the console until at least one AD Agent has been deployed.
This tab is comprised of a button bar and a table of domains being monitored. The events stream output needs to be designated to view data after an activity search has been performed.
Button Bar
The button bar allows users to take the following actions:

- Add Output – Select an output from the Add Output dropdown. The outputs are: File, Syslog, and StealthDEFEND. See the Output for Monitored Domains
- Remove – Removes the configured domain from the table of domains being monitored and end monitoring. Confirmation of this option will be asked for.
- Edit – Opens the selected AD Monitoring Configuration window to modify monitoring settings. See the AD Monitoring Configuration Window topic for additional information.
Table
The table of Domains being monitored provides the following information:
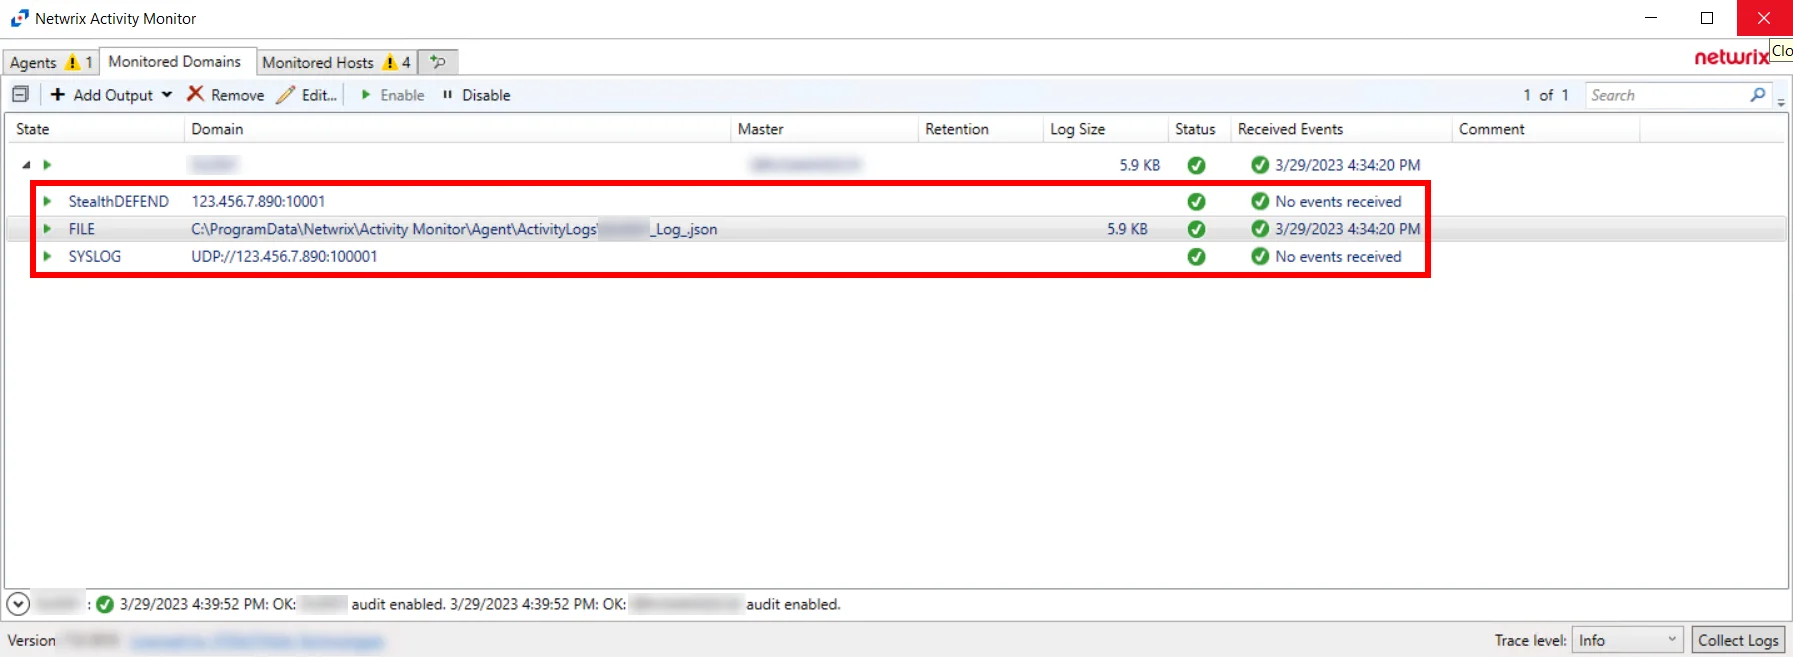
-
Domain – Name or IP Address of the domain being monitored
noteThe same domain can be monitored for different outputs. Each output is listed under the domain with destination information.
-
Master – Name or IP Address of the domain controller where the AD agent is deployed
-
Last Event – Date timestamp of the last event
Monitoring Status
The Error Propagation collapsible section located above the Status Bar of the Activity Monitor provides visibility into a domain's monitoring state. Domain monitoring status is depicted in the Monitored Domains table under the Status column. Users can expand the Error Propagation section to view more information on various status conditions.

Click the Down Arrow to expand the Error Propagation section. The information listed is dependent on which domain is currently selected in the Monitored Domains table.