System Logs
What the System Logs Tab Shows
Settings > System logs is a single searchable view of application logs from every Access Analyzer component, kept for 30 days. Only Admins can open it. Look here when Netwrix Activity Monitor events stop arriving, or when a scan execution's own logs don't explain a failure.
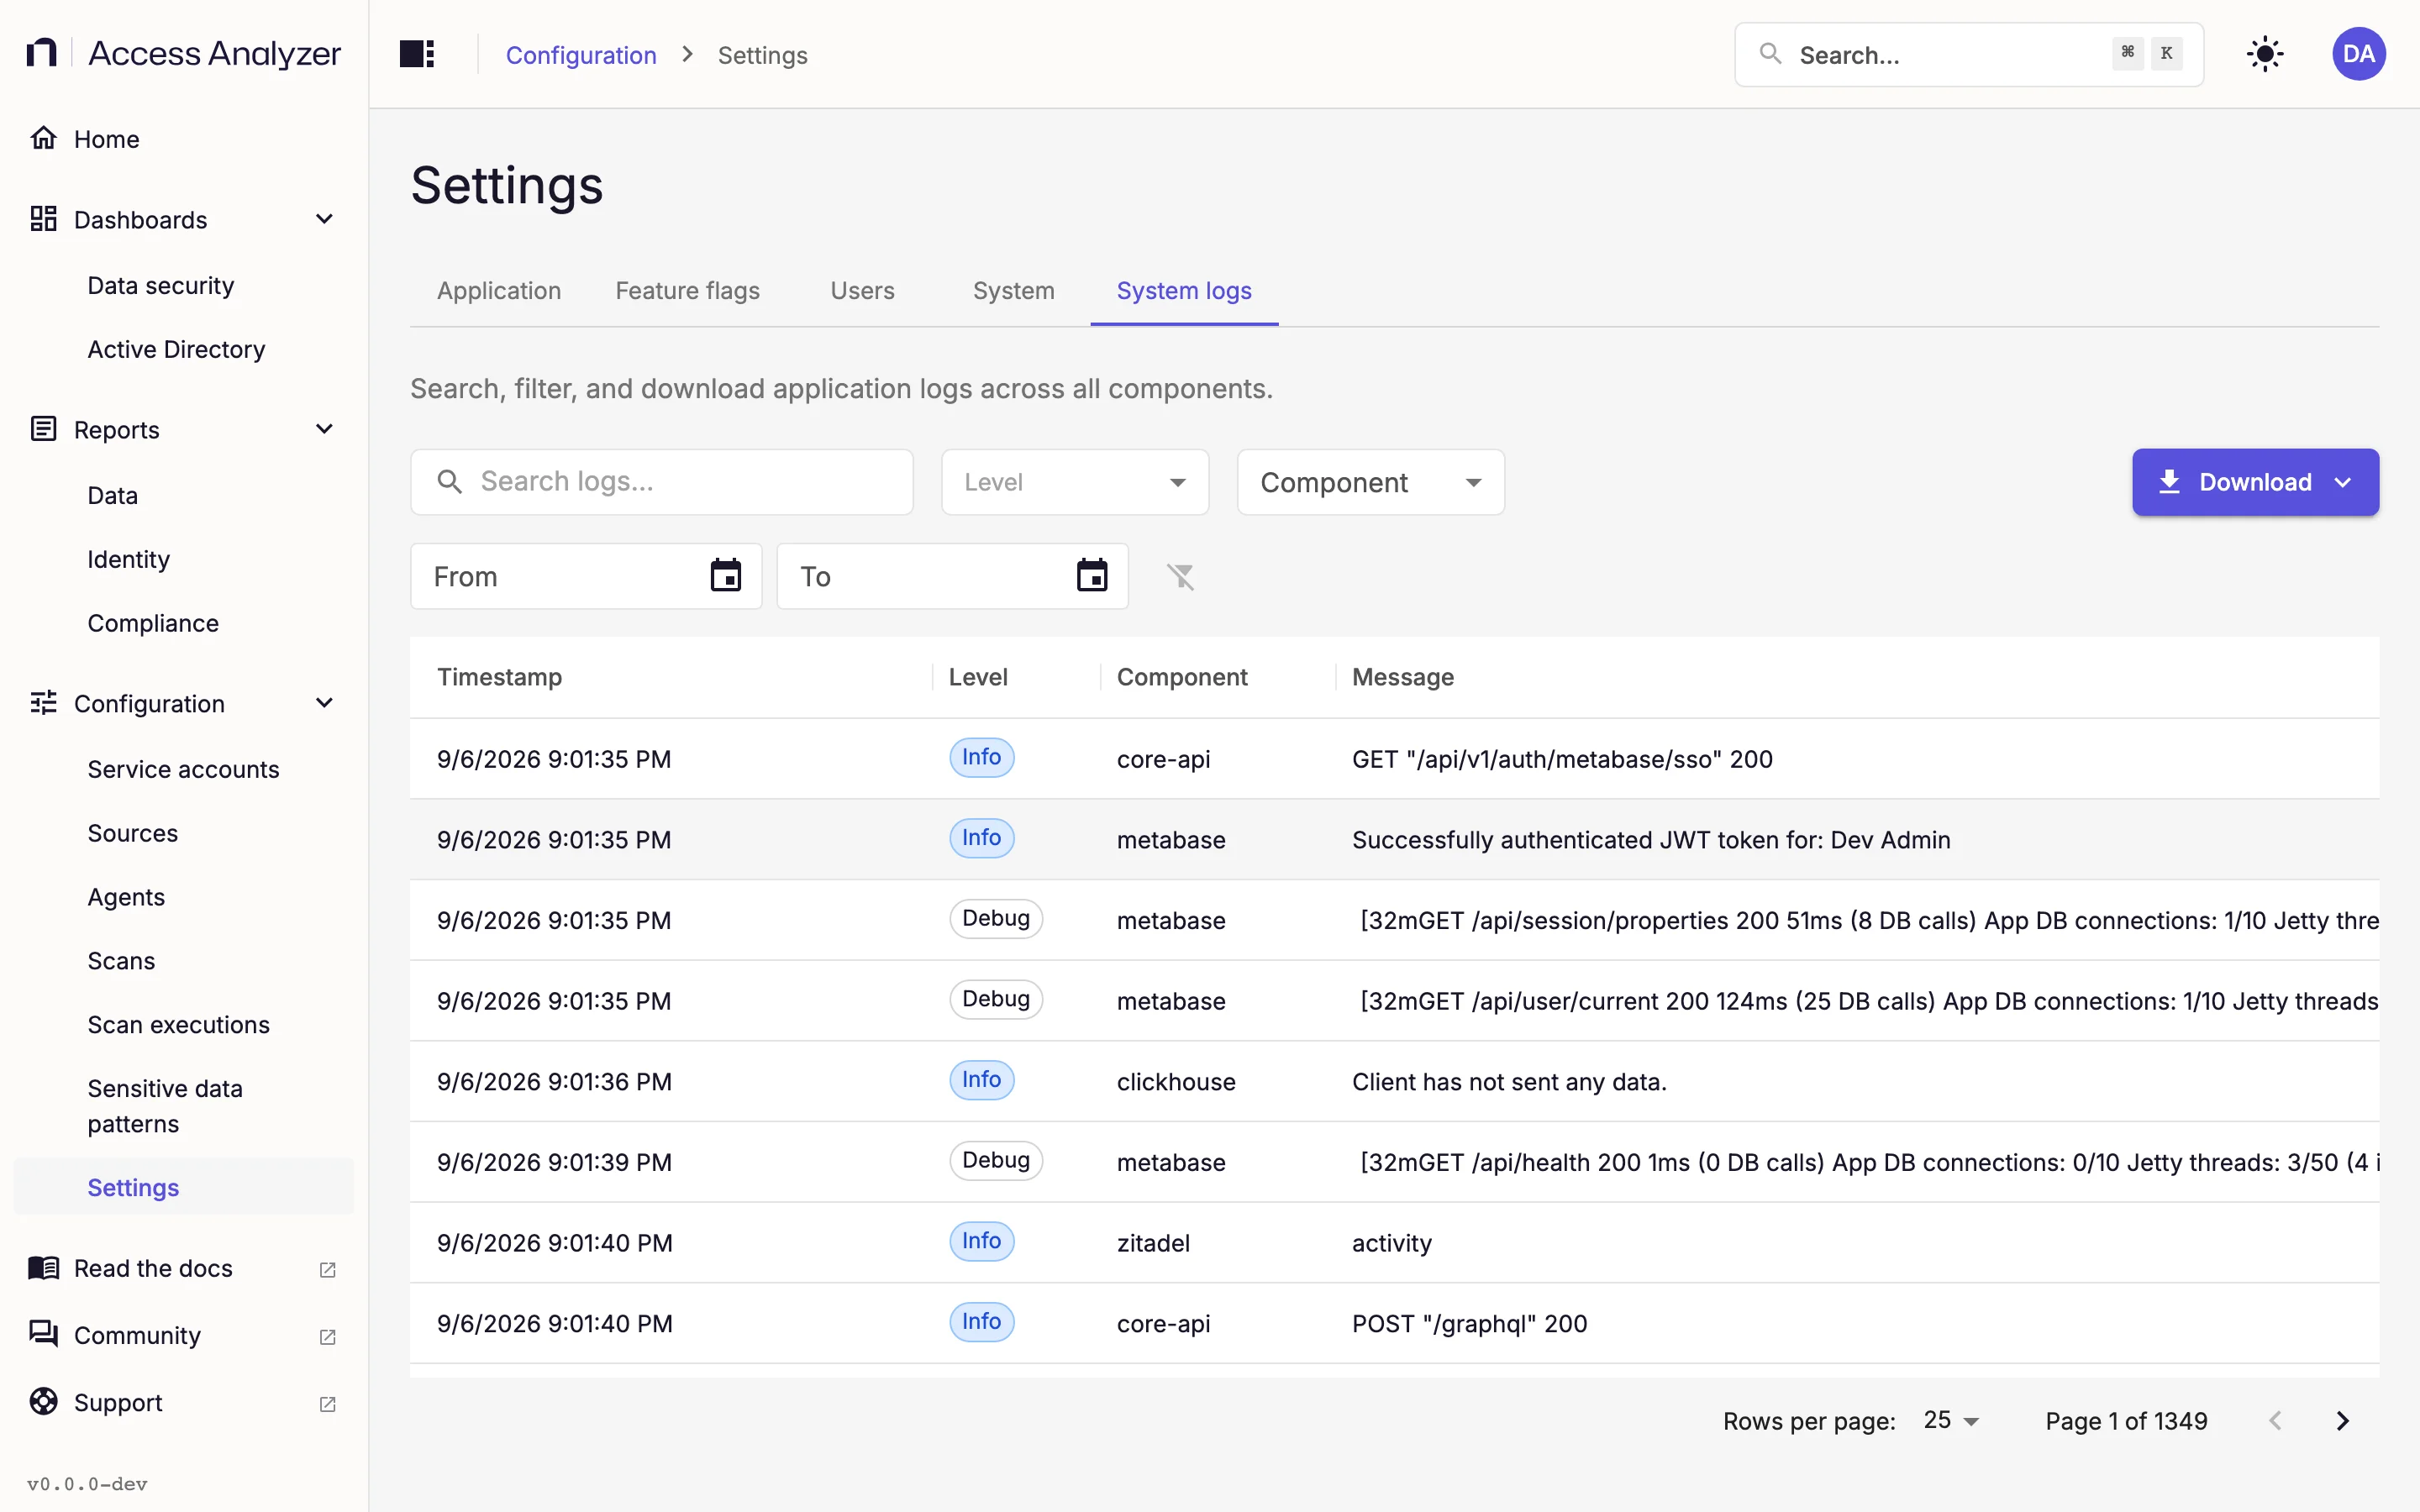
| Column | What it shows |
|---|---|
| Timestamp | When Access Analyzer wrote the entry. Sortable; newest first by default. |
| Level | A colored chip: Error (red), Warn (orange), Info (blue), or Debug (gray). |
| Component | The component that wrote the entry, or — when the entry names none. |
| Message | The log message on one line. Hover to read a long message in full. Entries that carry an error detail show it as a second line in red beneath the message. |
The table shows 25 rows per page by default; 10, 50, and 100 are also available. Click a row to open the Log details drawer. It repeats the level, timestamp, and component, shows the full text under MESSAGE, and lists every attribute recorded with the entry as key-value pairs under DETAILS.
Search and Filter
The toolbar narrows the table, and every filter also applies to downloads.
| Control | What it does |
|---|---|
| Search logs… | Case-insensitive substring match on the message, up to 1,000 characters. |
| Level | One level: All levels, Error, Warn, Info, or Debug. |
| Component | Any number of components, chosen with checkboxes. The list holds only components that appear in the retained logs. |
| From and To | A date and time range, picked as day/month/year with a 12-hour clock. There are no preset ranges. |
| Clear filters | Clears the active filters. Unavailable when no filter is active. |
The view doesn't refresh on its own; reload the page or change a filter to pick up new entries.
When troubleshooting Netwrix Activity Monitor, select only nam-listener (the Activity Monitor listener) under Component to see its messages alone. See Netwrix Activity Monitor.
Download Logs
Downloads come as JavaScript Object Notation (JSON) or CSV files.
- Set the filters so the table shows what you want to keep.
- Click Download.
- Click Download as JSON or Download as CSV. The button reads Downloading… until the file is ready.
The server builds the export and sends it to your browser as system-logs-<timestamp>.json or system-logs-<timestamp>.csv. It holds at most 10,000 entries that match the current filters. If you need more, split the time range with From and To and download each part.
JSON exports include the full entry: the timestamp, level, message, log attributes, resource attributes, trace ID, and span ID. CSV exports are flatter and carry these columns only:
Timestamp,SeverityText,Body,TraceID,SpanID
The component and the attributes shown in the Log details drawer aren't part of the CSV; use JSON when you need them. If the page shows Export not found or expired, click Download again.
Retention
Access Analyzer keeps log entries for 30 days and then removes them. You can't change the period. Download anything you need to keep longer.