Active Directory Dashboard
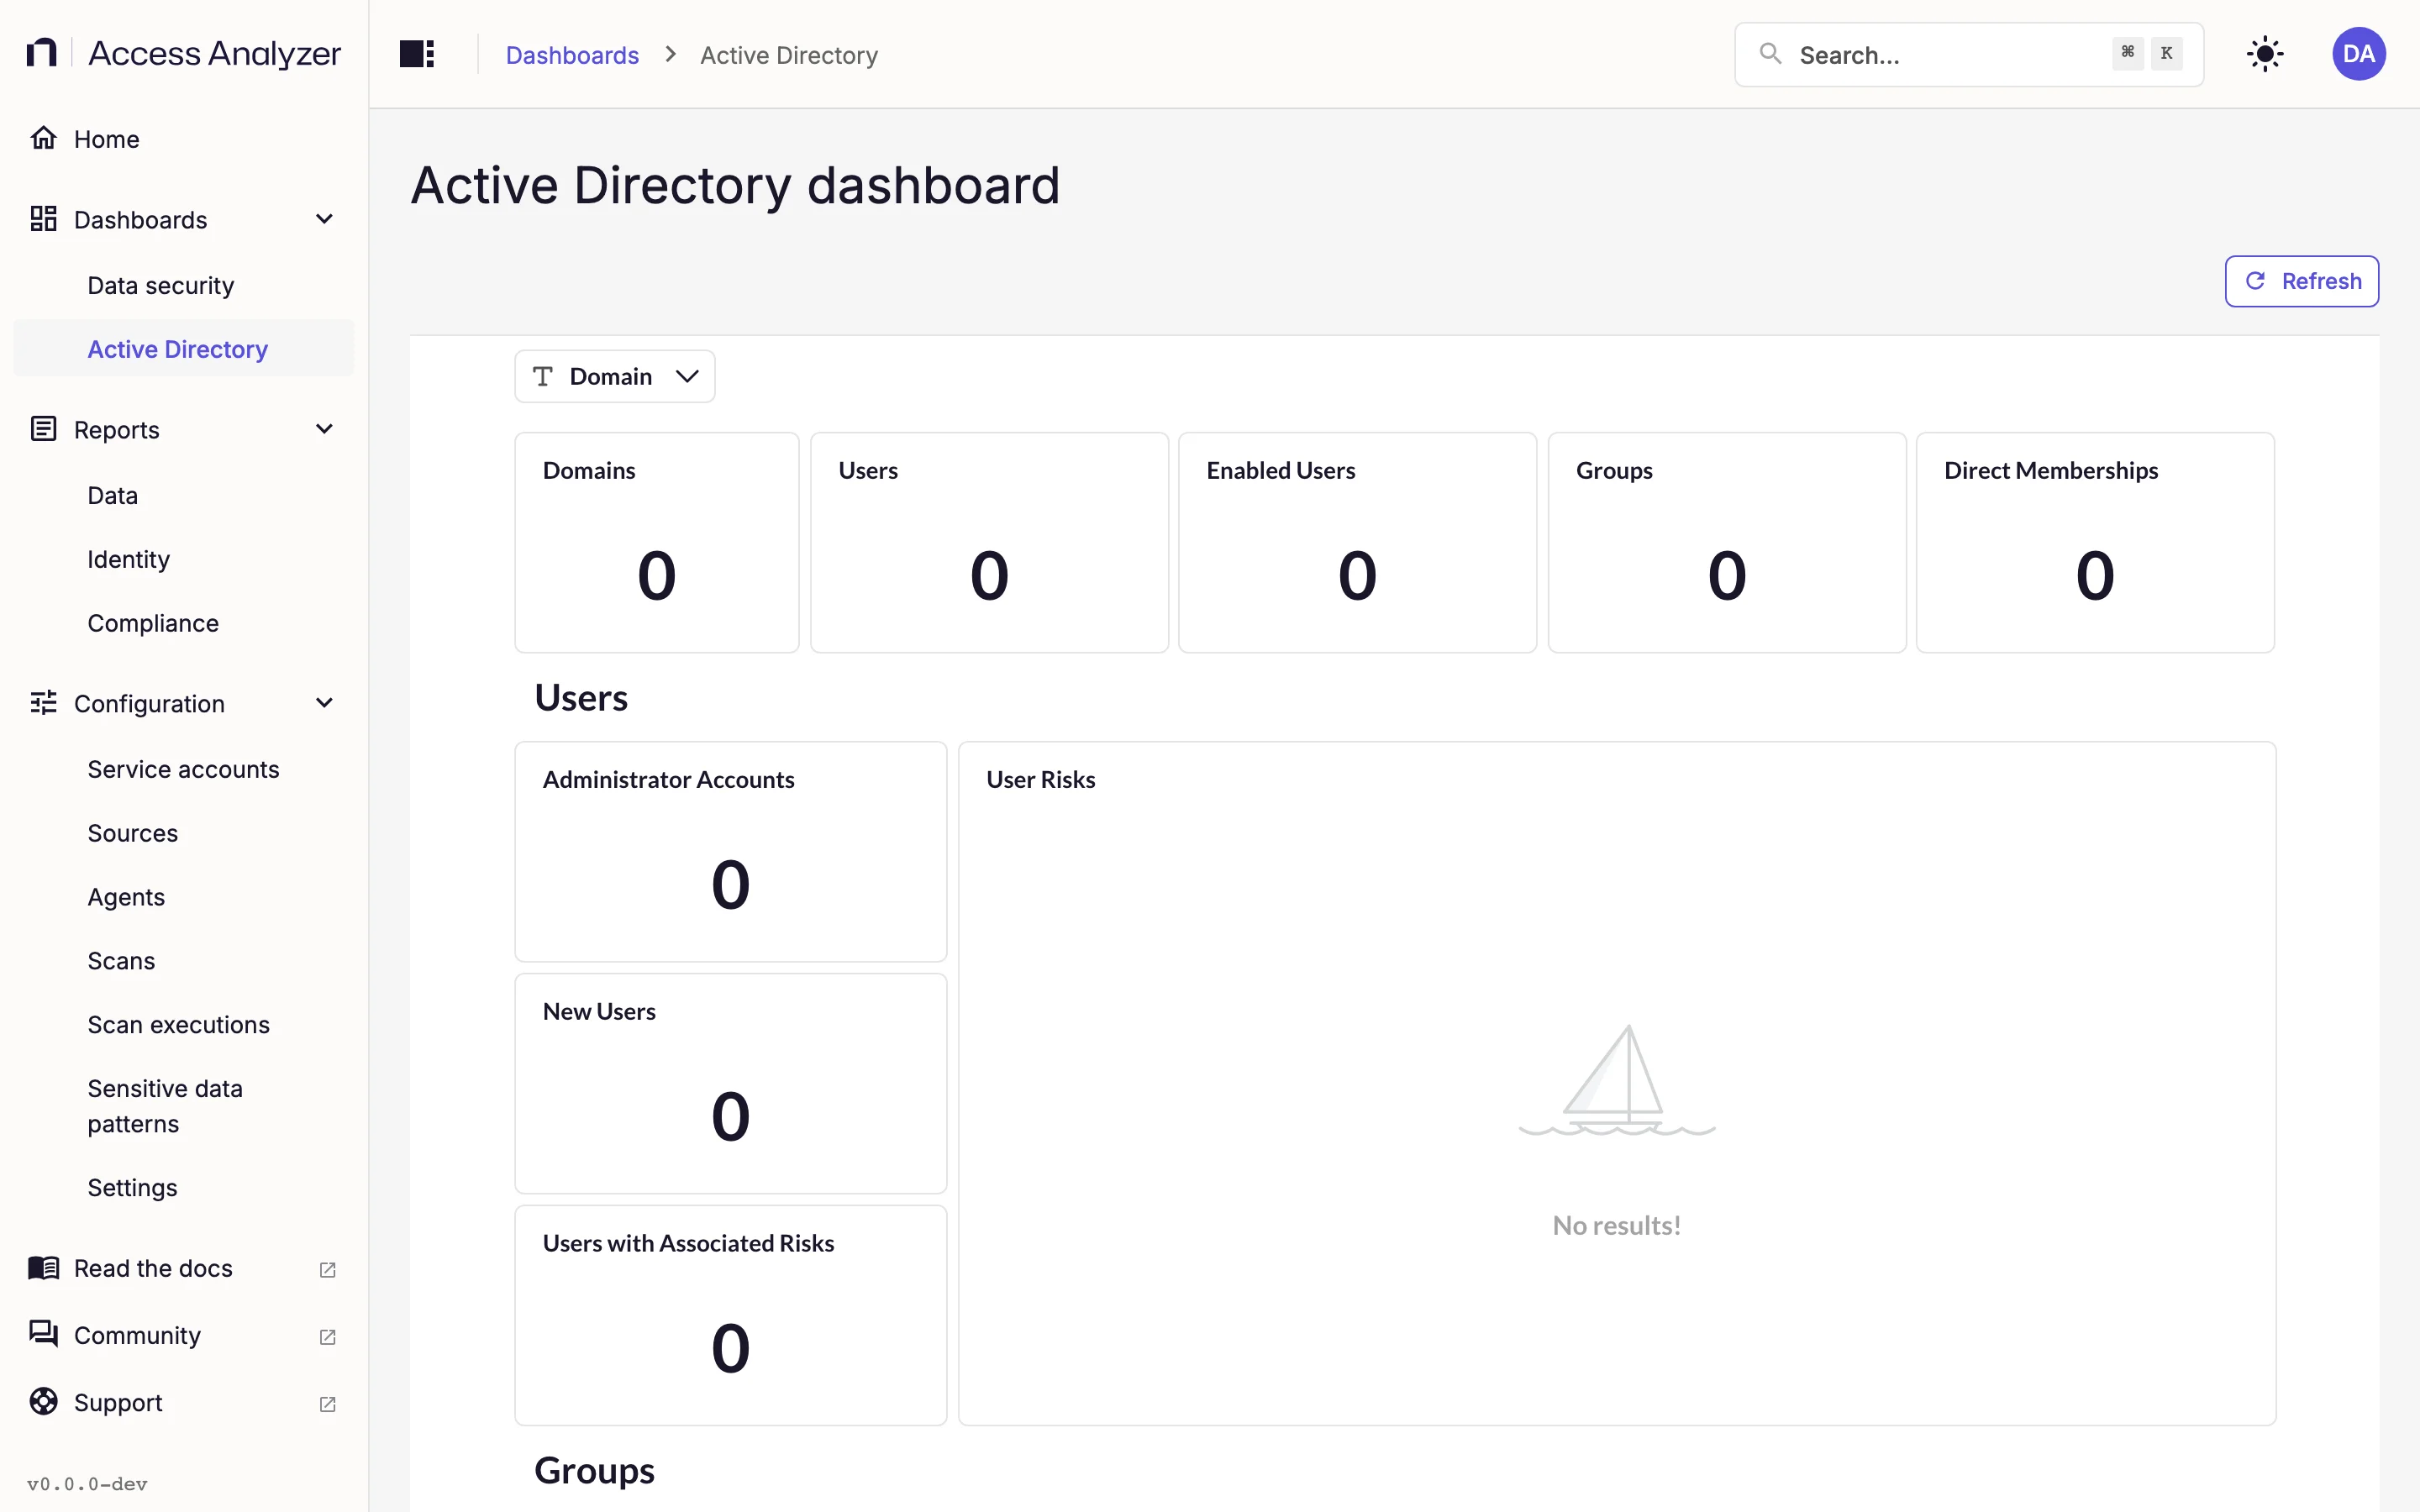
The Active Directory dashboard summarizes what an Identity sync collected from your domains. The top row counts domains, users, and groups. Below it, a Users section and a Groups section pair headline numbers with a breakdown of the risks found in each, and an All Risks section at the bottom lists every detected risk with its level and the object it concerns.
Open it from Dashboards > Active Directory. Users with the Admin or Viewer role can see it. Dashboards and reports explains the Refresh button, how to drill into a chart, and how fresh the numbers are.
Where the Data Comes From
Every card reads from an Identity sync on an Active Directory source. The dashboard needs no Access scan or Sensitive data scan, and no card depends on Netwrix Activity Monitor. Until the first Identity sync completes, the tiles show zero and the charts show No results!. Scan types explains how to run one; Active Directory explains the source itself.
Filter
The dashboard has one filter and no tabs.
| Filter | What it does |
|---|---|
| Domain | Restricts every card to one domain, chosen from the synced domains |
Leave Domain empty to see all domains together. Because every card responds to it, the filter is the quickest way to look at one domain at a time.
Summary Row
| Card | What it shows | How to read it |
|---|---|---|
| Domains | The number of distinct domains synced | Each synced domain counts once |
| Users | The number of user objects | Includes disabled accounts |
| Enabled Users | The number of users whose account status is Enabled | The difference between this and Users is the number of disabled accounts |
| Groups | The number of groups | Security groups and distribution lists together |
| Direct Memberships | The number of direct group membership entries | Direct means the count doesn't expand nested membership; the Administrator Accounts card does |
Users Section
| Card | What it shows | How to read it |
|---|---|---|
| Administrator Accounts | The number of effective memberships in the built-in privileged groups in the following list | Effective means the count follows nested membership, so an account inside a group inside Domain Admins counts |
| User Risks | A pie chart of user-category risks by risk type | Shows which kind of user risk dominates; Risk types explains each type |
| New Users | Users created in the past seven days | A quick check on recent provisioning |
| Users with Associated Risks | The number of risk entries in the User category | Drill into it, or scroll to Active Directory Risks, to see which accounts are involved |
Groups counted by Administrator Accounts
Domain Admins, Enterprise Admins, Schema Admins, Administrators, Account Operators, Backup Operators, Server Operators, Print Operators, Group Policy Creator Owners, Domain Controllers, Read-only Domain Controllers, DnsAdmins, Cert Publishers, Remote Desktop Users, Distributed COM Users, Cryptographic Operators, Pre-Windows 2000 Compatible Access, Replicator, Network Configuration Operators, Performance Monitor Users, Performance Log Users, Windows Authorization Access Group, Terminal Server License Servers, and Incoming Forest Trust Builders.
Groups Section
| Card | What it shows | How to read it |
|---|---|---|
| Security Groups | The number of groups whose type is Security | Compare with DLs to see how the Groups total splits |
| Group Risks | A pie chart of group-category risks by risk type | Shows which kind of group risk dominates |
| DLs | The number of distribution lists, meaning groups whose type isn't Security | Together with Security Groups, this accounts for every group in Groups |
| Groups with Associated Risks | The number of risk entries in the Group category | Drill into it, or scroll to Active Directory Risks, for the group names |
All Risks Section
| Card | What it shows | How to read it |
|---|---|---|
| Risks by Level | A pie chart of all risks by level: LOW, MEDIUM, or HIGH | Start remediation with the HIGH slice |
| Riskiest Objects | A table of risk counts grouped by domain and object name, highest first | The users and groups with the most detected risks |
| Active Directory Risks | The full list: one row per detected risk, with the risk type, the object and its domain, when Access Analyzer detected it, additional context, the level, the category, and a description | Use the Domain filter to keep this list manageable, then drill into a row |
Risk Types
Each row in Active Directory Risks carries one of the following risk types. The level and description are what you see in the table.
| Risk type | Level | Category | Description |
|---|---|---|---|
| Empty Groups | LOW | Group | Groups with no members |
| Single Member Groups | LOW | Group | Groups with exactly one member |
| Large Groups | MEDIUM | Group | Groups exceeding the defined membership threshold |
| Duplicate Groups | LOW | Group | Groups that contain identical effective membership sets |
| Circular Nesting | MEDIUM | Group | Groups that include themselves through recursive membership loops |
| Stale Users | MEDIUM | User | Users who have not logged on within the defined inactivity threshold |
| Very Stale Users | MEDIUM | User | Users who have not logged on within the defined inactivity threshold |
| Isolated Users | LOW | User | Enabled users not present in any group membership record |
| Old Password | HIGH | User | Users whose password age exceeds defined threshold, indicating stale credentials |
| DC Logon Rights | HIGH | User | Users who are direct or indirect members of privileged administrative groups granting Domain Controller logon rights |
| Users Without Logon Record | LOW | User | Users who have never logged on |
For account-level detail behind any of these, such as password age, last logon, and account status per user, open the AD Users report on the Identity reports page.