Active Directory Activity Auditing Configuration
There are two methods to configure Activity Monitor to provide Active Directory domain activity to Access Analyzer:
- API Server
- File Archive Repository
See the File Archive Repository Option topic for additional information on that option.
API Server Option
In this method, you will be deploying two agents:
-
First, deploy an Activity Agent to a Windows server that will act as the API server. This is a non-domain controller server.
infoDeploy the API Server to the same server where the Activity Monitor Console resides.
-
Next, deploy the AD Agent to all domain controllers in the target domain.
Set up integration between Activity Monitor and Access Analyzer through an API server.
Step 1 – Deploy the Activity Agent to the API server.
Step 2 – Deploy the AD Agent to each domain controller in the target domain.
The next step is to configure the agent deployed to the API server.
Configure API Server Agent
Configure the agent deployed to the API server.
Step 1 – On the Agents tab of the Activity Monitor Console, select the agent deployed to the API server.
Step 2 – Click Edit. The Agent properties window opens.
Step 3 – Select the API Server tab and configure the following:
-
Select the Enable API access on this agent checkbox.
-
The default API server port (TCP) is 4494, but you can modify it if desired. Ensure Access Analyzer also uses the modified port.
-
Click Add Application. The Add or edit API client window opens.
-
Configure the following:
-
Provide a descriptive and unique Application name, for example
Access Analyzer. -
Select the Read checkbox to grant this permission to this application.
-
Click Generate to generate the Client ID and Client Secret.
-
Copy the Client ID value to a text file.
-
Click Copy and save the Client Secret value to a text file.
warningYou can't retrieve the value after closing the Add or edit API client window. Copy it first.
-
By default, the Secret Expires in 3 days. That means you must use it in the Access Analyzer Connection Profile within 72 hours, or you will need to generate a new secret. Modify if desired.
-
Click OK to save the configuration and close the Add or edit API client window.
-
-
If the Activity Monitor Console server isn't the API Server, then click Use this console to grant the Activity Monitor the ability to manage the API server.
-
Use the IPv4 or IPv6 allowlist to limit access to the API server data to specific hosts.
Step 4 – Click OK to save the configuration and close the Agent properties window.
The next step is to configure the agents deployed to the domain controllers.
Configure Domain Controller Agent
Configure the agent deployed to the domain controller.
Step 1 – On the Agents tab of the Activity Monitor Console, select an agent deployed to domain controller.
Step 2 – Click Edit. The Agent properties window opens.
Step 3 – Select the Archiving tab and configure the following:
-
Select the Enable Archiving for this agent checkbox.
-
Select the Archive log files on a UNC path option. Click the ... button and navigate to the network share you want on the API server.
-
Fill in the User name and User password fields only if the account used to install the agent doesn't have access to this share.
tipRemember, The account used to install the agent on a domain controller is a Domain Administrator account.
-
Click Test to ensure a successful connection to the network share.
Step 4 – Click OK to save the configuration and close the Agent properties window.
Step 5 – Repeat Steps 1-4 for each agent deployed to domain controller.
These agents save the Archive logs to the selected share.
Configure Monitored Domain Output
Follow the steps configure the monitored domain output for Netwrix Access Analyzer (formerly Enterprise Auditor).
Step 1 – Select the Monitored Domains tab.
Step 2 – Select the domain you want and click Add Output. The Add New Ouptut window opens.
Step 3 – Configure the following:
-
Configure the number of days you want for the Period to keep Log files. This is the number of days the log files are kept on the API server you configured earlier. You need to set this to a greater value than the days between Access Analyzer scans.
- For example, if Access Analyzer runs the AD_ActivityCollection Job once a week (every 7 days), you should configure the Activity Monitor output to retain at least 10 days of log files.
-
Check the This log file is for StealthAUDIT box.
-
Optionally select the Enable periodic AD Status Check event reporting checkbox. When enabled, the agent will send out status messages every five minutes to verify whether the connection is still active.
Step 4 – Click Add Output to save and close the Add New Output window.
Access Analyzer now has access to the agent log files for this domain.
Configure Connection Profile
Configure the Connection Profile in Access Analyzer.
Remember, the API server generated the Client ID and Client Secret, and you copied them to a text file. If the secret expires before you configure the Connection Profile, you will need to re-generate it.
Step 1 – On the Settings > Connection node of the Access Analyzer Console, select the Connection Profile for the Active Directory solution. If you haven't yet created a Connection Profile or desire a specific one for AD Activity, create a new one and provide a unique descriptive name.
Step 2 – Click Add User credential. The User Credentials window opens.
Step 3 – Configure the following:
- Select Account Type – Select Web Services (JWT)
- User name – Enter the Client ID generated by the Activity Monitor API Server
- Access Token – Enter the Client Secret generated by the Activity Monitor API Server
Step 4 – Click OK to save and close the User Credentials window.
Step 5 – Click Save and then OK to confirm the changes to the Connection Profile.
Step 6 – Navigate to the Jobs > Active Directory > 6.Activity > 0.Collection Job Group. Select the Settings > Connection node.
Step 7 – Select the Select one of the following user defined profiles option. Expand the dropdown menu and select the Connection Profile with this credential.
Step 8 – Click Save and then OK to confirm the changes to the job group settings.
Access Analyzer will now use the Connection Profile for AD Activity collection.
Configure the AD_ActivityCollection Job
The Access Analyzer requires additional configurations to collect domain activity data. Configure the AD_ActivityCollection Job.
Ensure that you have successfully run the .Active Directory Inventory Job Group against the target domain.
Step 1 – Navigate to the Jobs > Active Directory > 6.Activity > 0.Collection > AD_ActivityCollection Job. Select the Configure > Queries node.
Step 2 – Click Query Properties. The Query Properties window displays.
Step 3 – On the Data Source tab, select Configure. The Active Directory Activity DC wizard opens.
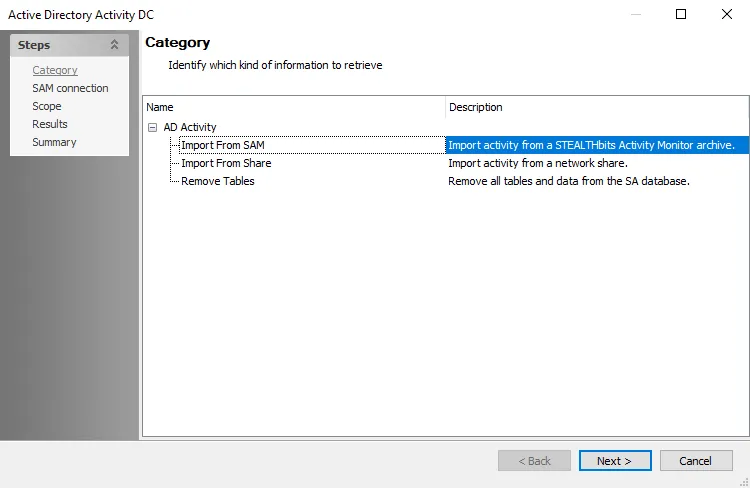
Step 4 – On the Category page, choose Import from SAM option and click Next.
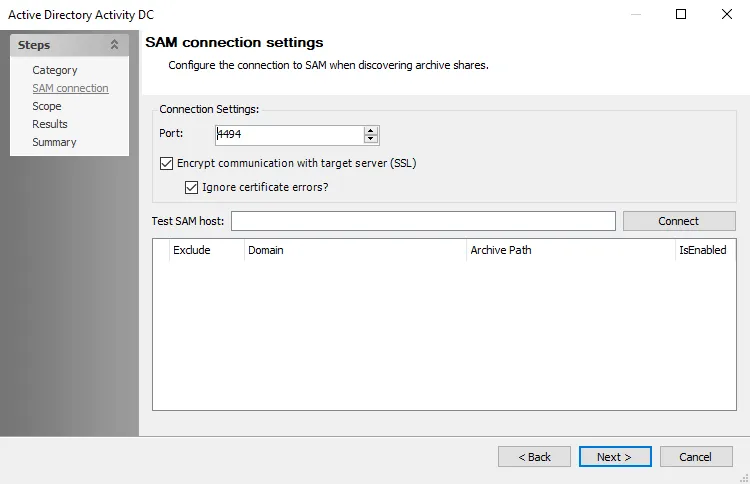
Step 5 – On the SAM connection page, the Port is set to the default 4494. This needs to match the port configured for the Activity Monitor API Server agent.
Step 6 – In the Test SAM host textbox, enter the Activity Monitor API Server name using
fully qualified domain format. For example, NEWYORKSRV30.NWXTech.com. Click Connect.
Step 7 – If connection is successful, the archive location displays along with a Refresh token. Copy the Refresh token. This will replace the Client Secret in the Connection Profile in the last step.
Step 8 – Click Next.
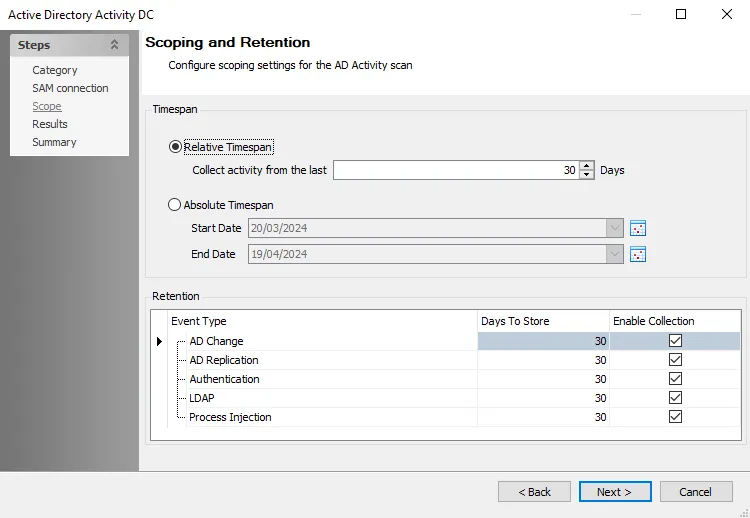
Step 9 – On the Scope page, set the Timespan as desired. There are two options:
- Relative Timespan – Set the number of days of activity logs to collect when the scan is run
- Absolute Timespan – Set the date range for activity logs to collect when the scan is run
You should set the threshold to ensure the logs are collected before the Activity Monitor domain output log retention expires. For example, if Access Analyzer runs the AD_ActivityCollection Job once a week (every 7 days), you should configure the Activity Monitor output to retain at least 10 days of log files.
Step 10 – Set the Retention period as desired. This is the number of days Access Analyzer keeps the collected data in the SQL Server database.
Step 11 – Click Next and then Finish to save the changes and close the wizard.
Step 12 – Click OK to save the changes and close the Query Properties page.
Step 13 – Navigate to the global Settings > Connection node to update the User Credential with the Refresh token:
- Select the Connection Profile assigned to the 6.Activity > 0.Collection Job Group.
- Select the Web Services (JWT) User Credential and click Edit.
- Replace the Access Token with the Refresh token generated by the data collector in Step 7.
- Click OK to save and close the User Credentials window.
- Click Save and then OK to confirm the changes to the Connection Profile.
Access Analyzer now targets the Activity Monitor API Server with this query to collect domain activity logs.
(Optional) Configure Import of AD Activity into Netwrix Access Information Center
The AD_ActivityCollection Job can import AD Activity data into Netwrix Access Information Center. However, this is disabled by default. Enable the import of AD activity data into the Access Information Center.
Step 1 – Navigate to the Jobs > Active Directory > 6.Activity > 0.Collection > AD_ActivityCollection Job.
Step 2 – On the job's Overview page, enable the import of AD Events.
- Click the Enable to import AD events into the AIC parameter.
- On the Parameter Configuration window, select the Enabled checkbox and click Save.
Step 3 – On the job's Overview page, enable the import of authentication Events.
- Click the Enable to import authentication events into the AIC parameter.
- On the Parameter Configuration window, select the Enabled checkbox and click Save.
Step 4 – Optionally, modify the List of attributes to track for Object Modified changes and Number of days to retain activity data in the AIC parameters.
You have now configured the AD_ActivityCollection Job to import both AD events and authentication events into the Netwrix Access Information Center.