Application
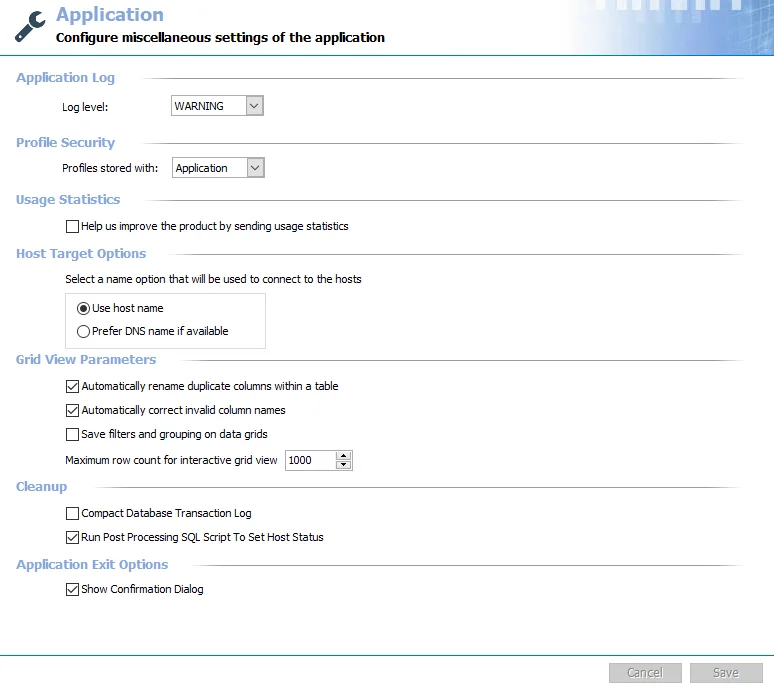
The Application node is for configuring general settings which affect the way the Enterprise Auditor Console functions.
Application Log
The Enterprise Auditor Application Log section determines what information is stored in the Enterprise Auditor application log.
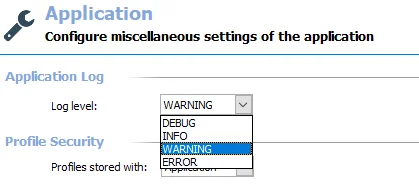
The Application log level controls the types of messages generated for each job and the application. You can modify it at the job level in the Job Properties window. See the General Tab topic for additional information. Options available in the Application log level dropdown menu include:
-
Debug – Records everything that happens during job execution, most verbose level of logging
- Records all Info level information
- Records everything else that happens
- Creates the largest file
-
Info – Records information about what stage of the job is being performed when errors or warnings occurred
- Records all Warning level information
- Records job progress information
-
Warning – Records all warnings which occur during job execution
- Records all Error level information
- Records all warnings and the time of occurrence
-
Error – Records all errors which occur during job execution
- Records job start time
- Records errors and the time of occurrence
- Records job completion time
Set the log level to Warning.
The other log levels help with troubleshooting job execution issues. Use the Debug level only when you're experiencing problems. After you fix the problem or send the Application log to Netwrix Support, reduce the logging level to Warning or Info.
Profile Security
The Profile Security section provides the option to enable an enhanced method of encryption to various credentials stored by the Enterprise Auditor application.
 .
.
There are two options available in the Profiles stored with dropdown menu:
- Application – Default setting, doesn't employ the enhanced encryption
- Vault – Enables the enhanced encryption of stored credentials. See the Vault topic for requirements and additional information.
Usage Statistics
Use the Usage Statistics section to select whether to send usage statistics data to Netwrix to help improve the product.

-
If you select this option, Enterprise Auditor collects and sends usage statistics to Netwrix
- Upon startup of the Enterprise Auditor console, the system checks whether it has sent usage statistics in the last 7 days. If it hasn't, stored procedures run against the Enterprise Auditor database and gather data about job runs, access times, and environmental details like resource counts, users counts, number of exceptions, and so on. Enterprise Auditor then sends this data back to Netwrix to help identify usage trends and common problem areas, which Netwrix uses to improve the product.
- Enterprise Auditor includes only anonymous statistic-level data and doesn't collect or send private company or personal data to Netwrix.
-
If you clear this option, Enterprise Auditor doesn't collect or send usage statistics to Netwrix
Host Target Options
The Host Target Options section provides radio buttons to select the source that Enterprise Auditor should use to connect to hosts.

Select from the following two options:
- Use host name
- Prefer DNS name if available
Grid View Parameters
The Grid View Parameters section controls how the data grids display within the Enterprise Auditor Console.

-
Automatically rename duplicate columns within a table – Checks for and renames columns with duplicate names
-
Automatically correct invalid column names – Checks for and corrects column names which contain characters SQL can't handle
infoLeave both options selected.
-
Save filters and grouping on data grids – Maintains filters configured for a data grid for the next viewing. If you don't select this option, filtered data grids reset between viewings.
-
Maximum row count for interactive grid view – Indicates the number of rows displayed in tables accessible in under a job’s Status and Results nodes
- The default maximum row count is 1000, with a cap of 99,999 rows. This number doesn't impact the number of rows within the SQL database. To view the full row count for a table exceeding this size, use the SQL Server Management Studio or another SQL Server interface tool which displays the full table.
You keep filtered data grids only if you save persistent filters. The Filtration Dialog available for every data grid maintains a list of recent filters. See the Data Grid Functionality topic for additional information.
Cleanup
The Cleanup section is designed to conserve space in the SQL Database Transaction Log. It only works when the database is configured to use Simple Recovery Model.

-
Compact Database Transaction Log – If you select this option, Enterprise Auditor compacts the Database Transaction Log every time you close the application
infoIn most environments, leave this option selected. If a scheduled task ends while multiple tasks are still running, the process of compacting the database freezes it and causes the running tasks to fail.
-
Run Post Processing SQL Script to Set Host Status – If you select this option, Enterprise Auditor ascribes the values of SUCCESS, WARNING, or ERROR to indicate what happened on that host during job execution
infoLeave this option selected.
Application Exit Options
The Application Exit Options section controls whether Enterprise Auditor displays a confirmation when you close the application.

If you select the Show Confirmation Dialog option, a Confirm Exit window opens when the Enterprise Auditor user attempts to exit the application. If you don't select this option, the Enterprise Auditor application closes without confirmation.

The Confirm Exit window requires you to click Yes before the Enterprise Auditor application closes.
The Cancel and Save buttons are in the lower-right corner of the Application view. These buttons become enabled when modifications are made to the Application global settings. Whenever changes are made at the global level, click Save and then OK to confirm the changes. Otherwise, click Cancel if no changes were intended.